Coin & Dice Probability: Using A Tree Diagram
Related Pages
More Tree Diagrams
Probability Tree Diagrams
More Lessons On Probability
Probability Worksheets
In these lessons, we will look at some examples of probability problems involving coins, dice and spinners. We will use tree diagrams to help solve the problems. We will see that tree diagrams can be used to represent the set of all possible outcomes involving one or more experiments.
Probability Tree Diagrams
Probability tree diagrams are visual tools used to calculate probabilities of sequences of events. They are particularly useful when dealing with two or more events happening in succession.
The following diagram shows how to answer a probability word problem using a probability tree diagram. Scroll down the page for more examples and solutions on using probability tree diagrams.

Probability Worksheets
Practice your skills with the following probability worksheets:
Printable & Online Probability Worksheets
How to Draw a Probability Tree Diagram:
Let’s illustrate with an example: Tossing a fair coin twice.
- Draw the branches for the first event.
Start with the root.
Draw branches for each possible outcome of the first event. Label each branch with the outcome and its probability. - Extend branches for the second event (and subsequent events).
From the end of each branch of the first event, draw new branches for the possible outcomes of the second event.
Label these branches with their outcomes and probabilities. - List all possible combined outcomes.
At the end of the final branches, list the sequence of outcomes for each path. - Calculate the probability of each combined outcome.
To find the probability of a specific sequence of events (a “path” from start to end), multiply the probabilities along the branches of that path.
Key Rules and Concepts:
- Probabilities on a single set of branches sum to 1: For each node, the probabilities of the branches extending from it must add up to 1. This helps in finding missing probabilities.
- Multiply along the branches (“AND” rule): To find the probability of a sequence of events occurring (e.g., getting a Head AND then a Head), you multiply the probabilities along the corresponding path.
- Add probabilities of separate outcomes (“OR” rule): If you want to find the probability of more than one specific outcome (e.g., getting exactly one Head), you calculate the probability of each relevant path and then add those probabilities together.
- Sum of all final outcomes probabilities is 1: Once all final outcomes are listed and their probabilities calculated, their sum should always equal 1. This is a good way to check your work.
Videos
Coins And Probability Trees
Probability using Probability Trees.
Example 1:
A coin is biased so that it has 60% chance of landing on heads. If it is thrown three times, find the probability of getting:
(a) 3 heads,
(b) 2 heads and a tail,
(c) at least one head.
Example 2:
In a bag of ten marbles, three are red and seven are green.
Two marbles are drawn out at random.
With the aid os a probability tree, find the probability of:
(a) choosing 2 red marbles.
(b) choosing 2 marbles that are the same colour.
(c) choosing different coloured marbles.
The following video gives more examples of probability involving coins and using tree diagrams.
You flip 3 coins. What is the theoretical probability of getting 2 heads and 1 tails?
Example 1: Coin and Dice
Example:
A fair coin and a fair dice are thrown at random. Find the probability of:
a) getting a head and an even number
b) getting a head or tail and an odd number
Solution:
We can use a tree diagram to help list all the possible outcomes.

From the diagram, n(S) = 12
a) Let A denote the event of a head and an even number.
A = ((H, 2), (H, 4), (H, 6)} and n(A) = 3
![]()
b) Let B denote the event a head or tail and an odd number.
B = {(H, 1), (H, 3), (H, 5), (T, 1), (T, 3), (T, 5)}
![]()
Example 2: Coins
Example:
Clare tossed a fair coin three times.
a) Draw a tree diagram to show all the possible outcomes.
b) Find the probability of getting:
(i) Three tails.
(ii) Exactly two heads.
(iii) At least two heads.
Solution:
a) A tree diagram of all possible outcomes.

b) The probability of getting:
(i) Three tails.
Let S be the sample space and A be the event of getting 3 tails.
n(S) = 8; n(A) = 1
P(A) = ![]()
ii) Exactly two heads.
Let B be the event of getting exactly 2 heads.
n(B) = 3
P(B) = ![]()
iii) At least two heads.
Let C be the event of getting at least two heads.
n(C) = 4
P(C) = ![]()
Example 3: Spinner and Coin
Example:
A spinner is labeled with three colors: Red, Green and Blue. Marcus spun the spinner once and
tossed a coin once.
a) Draw a tree diagram to list all the possible outcomes.
b) Calculate the probability of getting blue on the spinner and head on the coin.
c) Calculate the probability of red or green on the spinner and tail on the coin.
Solution:
a) A tree diagram of all possible outcomes.
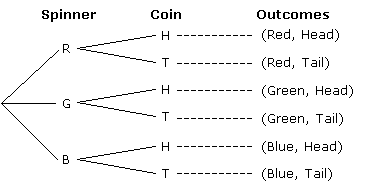
b) The probability of getting blue on the spinner and head on the coin.
Let S be the sample space and A be the event of getting blue and head
n(S) = 6 ; n(A) = 1
P(A) = ![]()
c) The probability of red or green on the spinner and tail on the coin.
Let B be the event of getting red or green and tail
n(B) = 2
P(A) = ![]()
Check out our most popular games!
Fraction Concoction Game:
Master fractions in the lab: mix, add, and subtract beakers to create the perfect concoction!

Fact Family Game:
Complete fact families and master the link between addition & subtraction and multiplication & division.

Number Bond Garden:
Clear the board by matching number pairs that sum to ten in this garden-themed mental math puzzle.

Online Addition Subtraction Game:
Practice your addition and subtraction skills to help the penguin find its mummy.

We welcome your feedback, comments and questions about this site or page. Please submit your feedback or enquiries via our Feedback page.