Probability Tree Diagrams
Related Pages
Tree Diagrams
More Lessons On Probability
Probability Worksheets
Theoretical And Experimental Probability
In these lessons, we will learn
- how to draw probability tree diagrams for independent events (with replacement),
- how to draw probability tree diagrams for dependent events (without replacement)
What Is A Probability Tree Diagram
Printable & Online Probability Worksheets
We can construct a probability tree diagram to help us solve some probability problems.
A probability tree diagram shows all the possible events. The first event is represented by a dot. From the dot, branches are drawn to represent all possible outcomes of the event. The probability of each outcome is written on its branch.
Example:
A bag contains 3 black balls and 5 white balls. Paul picks a ball at random from the bag and replaces it
back in the bag. He mixes the balls in the bag and then picks another ball at random from the bag.
a) Construct a probability tree of the problem.
b) Calculate the probability that Paul picks:
i) two black balls
ii) a black ball in his second draw
Solution:
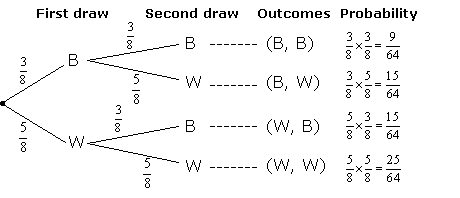
a) Check that the probabilities in the last column add up to 1.
![]()
b) i) To find the probability of getting two black balls, first locate the B branch and then follow the
second B branch. Since these are independent events we can multiply the probability of each branch.
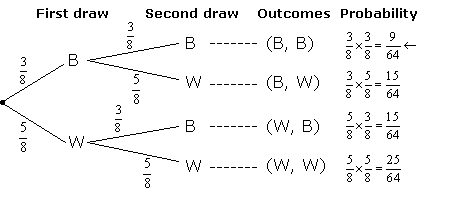
ii) There are two outcomes where the second ball can be black, either (B, B) or (W, B)
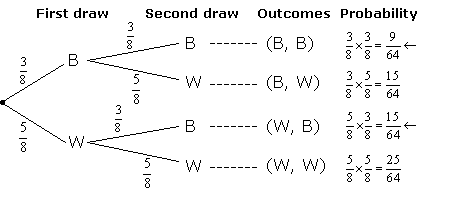
From the probability tree diagram, we get:
![]()
P(second ball black)
= P(B, B) or P(W, B)
= P(B, B) + P(W, B)

Example:
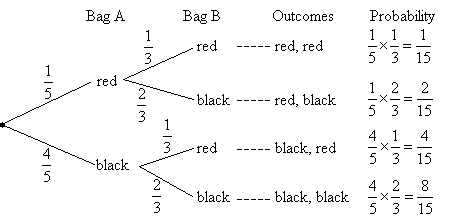
Bag A contains 10 marbles of which 2 are red and 8 are black. Bag B contains 12 marbles of which 4 are
red and 8 are black. A ball is drawn at random from each bag.
a) Draw a probability tree diagram to show all the outcomes the experiment.
b) Find the probability that:
(i) both are red.
(ii) both are black.
(iii) one black and one red.
(iv) at least one red.
Solution:
a) A probability tree diagram that shows all the outcomes of the experiment.
b) The probability that:
(i) both are red.
P(R, R) = ![]()
(ii) both are black.
P(B, B) = ![]()
(iii) one black and one red.
P(R, B) or P(B, R) = ![]()
(iv) at least one red.
1 - P(B, B) = ![]()
Example:
A box contains 4 red and 2 blue chips. A chip is drawn at random and then replaced. A second chip is
then drawn at random.
a) Show all the possible outcomes using a probability tree diagram.
b) Calculate the probability of getting:
(i) at least one blue.
(ii) one red and one blue.
(iii) two of the same color.
Solution:
a) A probability tree diagram to show all the possible outcomes.
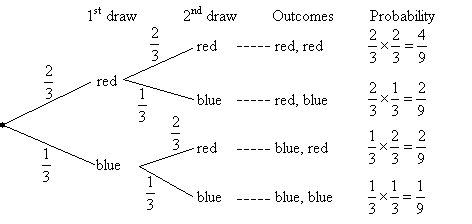
b) The probability of getting:
(i) at least one blue.
P(R, B) or P(B, R) or P(B, B) = ![]()
(ii) one red and one blue.
P(R, B) or P(B, R) = ![]()
(iii) two of the same color.
P(R, R) or P(B, B) = ![]()
Probability Tree Diagrams For Independent Events
How To Solve Probability Problems Using Probability Tree Diagrams?
Example:
A coin is biased so that it has a 60% chance of landing on heads. If it is thrown three times,
find the probability of getting
a) three heads
b) 2 heads and a tail
c) at least one head
How To Use A Tree Diagram To Calculate Combined Probabilities Of Two Independent Events?
Example:
Jenny has a bag with seven blue sweets and 3 red sweets in it.
She picks up a sweet at random from the bag, replaces it and then picks again at random.
Draw a tree diagram to represent this situation and use it to calculate the probabilities that she picks:
(a) two red sweets
(b) no red sweets
(c) at least one blue sweet
(d) one sweet of each color
Probability Tree Diagrams For Dependent Events
How To Use A Probability Tree Diagram To Calculate Probabilities Of Two Events Which Are Not Independent?
Example:
Jimmy has a bag with seven blue sweets and 3 red sweets in it.
He picks up a sweet at random from the bag, but does not replaces it and then picks again at random.
Draw a tree diagram to represent this situation and use it to calculate the probabilities that he picks:
(a) two red sweets
(b) no red sweets
(c) at least one blue sweet
(d) one sweet of each color
How To Use A Probability Tree Diagram To Calculate Probabilities Of Two Events Which Are Dependent?
Example:
Inside a bag there are 3 green balls, 2 red balls and and 4 yellow balls. Two balls are randomly drawn
without replacement. Calculate the probability of drawing one red ball and one yellow ball.
Try out our new and fun Fraction Concoction Game.
Add and subtract fractions to make exciting fraction concoctions following a recipe. There are four levels of difficulty: Easy, medium, hard and insane. Practice the basics of fraction addition and subtraction or challenge yourself with the insane level.

We welcome your feedback, comments and questions about this site or page. Please submit your feedback or enquiries via our Feedback page.