Stem And Leaf Plot
Related Pages
Stem and Leaf Diagrams
Frequency Distributions
Statistics Lessons
In these lessons, we will learn how to draw and interpret a Stem and Leaf Plot.
What is a Stem and Leaf Plot?
When there are many numbers in a set of data, we can construct a stem and leaf plot
to show the data and make it easier to read.
A stem and leaf plot is a special type of table where:
Stem: Represents the higher place value digits of a number. These are listed vertically in increasing order.
Leaf: Represents the last digit (or digits, depending on how you define your leaf unit) of a number. These are listed horizontally, extending from their corresponding stem, typically in increasing order.
A key is always included with a stem and leaf plot to explain what the stems and leaves represent (e.g., “1 | 2 means 12”).
The following diagram shows how to construct a stem-and-leaf plot or stem plot. Scroll down the page for more examples and solutions on how to construct and use stem-and-leaf plots.

Statistics Worksheets
Practice your skills with the following worksheets:
Printable & Online Statistics Worksheets
Drawing A Stem-And-Leaf Plot
Example:
Construct a stem-and-leaf plot for the following set of data.
28 13 26 12 20 14 21 16 17 22
17 25 13 30 13 22 15 21 18 18
16 21 18 31 15 19
Solution:
Step 1: Find the least number and the greatest number in the data set.
The greatest number is 31 (3 in the tens place)
The smallest number is 12 (1 in the tens place)
Step 2: Draw a vertical line and write the digits in the tens places from 1 to 3 on the left of the line. The tens digit form the stems.
![]()
Step 3: Write the units digit to the right of the line. The units digits form the leaves.
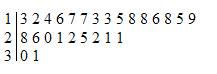
Step 4: Rewrite the units digits in each row from the least to the greatest.
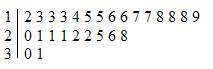
Step 5: Include an explanation (or key).
![]()
Interpret A Stem-And-Leaf Plot
Example:
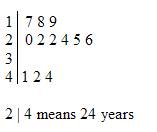
The following stem-and-leaf plot shows the ages of a group of people in a room.
a) How many people were there in the room?
b) Two people have the same age. What is that age?
c) What is the mode, median and mean of the ages?
Solution:
a) We count the number of digits on the right of the line (leaves). There were 12 people in the room.
b) The two people were 22 years old.
c) The mode is 22.
The median can be obtained from the average 6th and 7th data.
The average of 22 and 24 is 23.
The median age is 23
To get the mean, we have to first get the total ages.
17 + 18 + 19 + 20 + 22 + 22 + 24 + 25 + 26 + 41 + 42 + 44 = 320
The mean = ![]() = 26.67
= 26.67
Stem and Leaf Plots
This video shows how to make a stem and leaf plot, also known as a stem plot.
Statistics - How to make a stem and leaf plot
This example shows how to make a stem and leaf plot. Remember that the leading values become our stems
and the trailing values the leaves. There also may be more than one way to represent a stem and leaf plot.
Lesson on Stem and Leaf Plots
It includes demonstration on how to create and read a stem-and-leaf plot and also how to use it to
find Median and Quartiles.
How to create stem-and-leaf plots or frequency tables using given data
Answer questions based on given stem-and-leaf plots or frequency tables.
Advantages of Stem and Leaf Plots
- Retains Original Data: Unlike histograms, you can see the actual data values.
- Shows Data Distribution: It quickly displays the shape, center, and spread of the data (like a histogram). You can see if it’s symmetric, skewed, or has clusters.
- Easy to Create Manually: Can be constructed quickly by hand for small to moderate data sets.
- Identifies Outliers: Unusual values (outliers) are often easily visible as leaves far removed from the main cluster.
- Useful for Comparing Data Sets: Two stem and leaf plots can be placed back-to-back (common stem, leaves extending left and right) to compare distributions.
Disadvantages of Stem and Leaf Plots
- Not Suitable for Large Data Sets: Becomes unwieldy and hard to read with too many data points.
- Limited for Small Ranges: If data is very compressed, it might not show enough detail.
- Difficulty with Certain Data Types: Can be awkward for very small or very large numbers unless scaling is carefully chosen.
Interpreting a Stem and Leaf Plot
To interpret a stem and leaf plot, you look for:
Shape: Is the data clustered in the middle? Is it spread out? Is it skewed (more data on one side)?
Center: Where do most of the leaves fall? This gives an idea of the typical value.
Spread: What is the range of the data (from the lowest to the highest leaf)?
Clusters: Are there groups of data points?
Gaps: Are there any intervals where no data points fall?
Outliers: Are there any values that stand far apart from the rest of the data?
Check out our most popular games!
Fraction Concoction Game:
Master fractions in the lab: mix, add, and subtract beakers to create the perfect concoction!

Fact Family Game:
Complete fact families and master the link between addition & subtraction and multiplication & division.

Number Bond Garden:
Clear the board by matching number pairs that sum to ten in this garden-themed mental math puzzle.

Online Addition Subtraction Game:
Practice your addition and subtraction skills to help the penguin find its mummy.

We welcome your feedback, comments and questions about this site or page. Please submit your feedback or enquiries via our Feedback page.