Mean, Median, Mode and Range
Related Pages
Mean
Median
Mode
Central Tendency
More Statistics Lessons
These lessons help GMAT students review mean, median, mode and range.
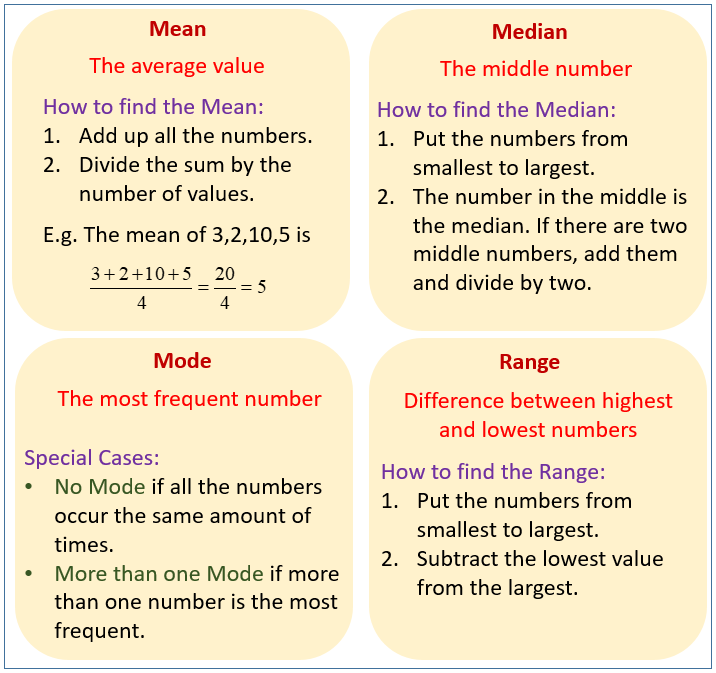
Mean, median, mode and range are fundamental concepts in statistics that help describe and summarize a set of data. They are measures of central tendency and variability used to describe a dataset.
The following diagrams show how to find the mean, median, mode and range. Scroll down the page for examples and solutions.

Statistics Worksheets
Practice your skills with the following worksheets:
Printable & Online Statistics Worksheets
- Mean:
The mean is the average of a dataset.
It’s calculated by adding up all the values in the dataset and then dividing by the total number of values.
Formula: Mean = (Sum of all values) / (Number of values)
Best for symmetric data (no outliers). - Median:
The median is the middle value in a dataset that is ordered from least to greatest.
To find the median:
Arrange the data in ascending order.
If there’s an odd number of values, the median is the single middle value.
If there’s an even number of values, the median is the average of the two middle values.
Best for skewed data (with outliers). - Mode:
The mode is the value that appears most frequently in a dataset.
A dataset can have:
No mode (if all values occur with the same frequency).
One mode (unimodal).
Two modes (bimodal).
More than two modes (multimodal). - Range:
The range is the difference between the largest and the smallest values in a dataset.
It indicates the spread of the data.
Formula: Range = Largest value - Smallest value
In summary, these four measures provide different insights into the central tendency and spread of a dataset. The mean gives the typical average, the median identifies the central point, the mode highlights the most common value, and the range shows how much the data varies.
Statistics: The Average
Introduction to descriptive statistics and central tendency.
Ways to measure the average of a set: median, mean, mode
Mean, Median, and Mode
Learn about Mean, Median, and Mode
Mean, median and mode are measures of central tendency.
Mean: add together and divide by how many there are.
Median: the middle number when the data is listed in order from smallest to largest. If there are 2 middle number, add them and divide by 2.
Mode: the most frequent number.
Example:
Find the mean, median and mode of this set of data.
35,8,12,50,55,22,34,22,34
Mean, Median and Mode
This lesson shows how to calculate Mean, Median and Mode and some tricks to help you remember the differences
of these methods of finding the Center.
The mean is the average.
To calculate the mean, you add add the values and divide by the number of values.
Examples:
- If you had 20 pencils in one box and 30 pencils in a second box, what is the average number of pencils in your boxes?
- Your grades out of 20 are all listed below. What is your average grade out of 20?
15, 16, 20, 12, 18, 20, 17
The median is the center.
List the numbers in order and pick the center one. If there are an even number of numbers find the mean of the
two middle numbers.
The mode is the number that shows up the most. There can be more than one mode. If the values all appear the
same number of times, there is no mode.
Try out our new and fun Fraction Concoction Game.
Add and subtract fractions to make exciting fraction concoctions following a recipe. There are four levels of difficulty: Easy, medium, hard and insane. Practice the basics of fraction addition and subtraction or challenge yourself with the insane level.

We welcome your feedback, comments and questions about this site or page. Please submit your feedback or enquiries via our Feedback page.