Line Graph Worksheets
Related Pages
Math Worksheets
Lessons for Fifth Grade
Free Printable Worksheets
Printable “Statistics” Worksheets:
Bar Graphs (2nd Grade)
Line Plots (2nd Grade)
Scaled Bar Graphs (3rd Grade)
Line Graphs (5th Grade)
Line Graph Worksheets
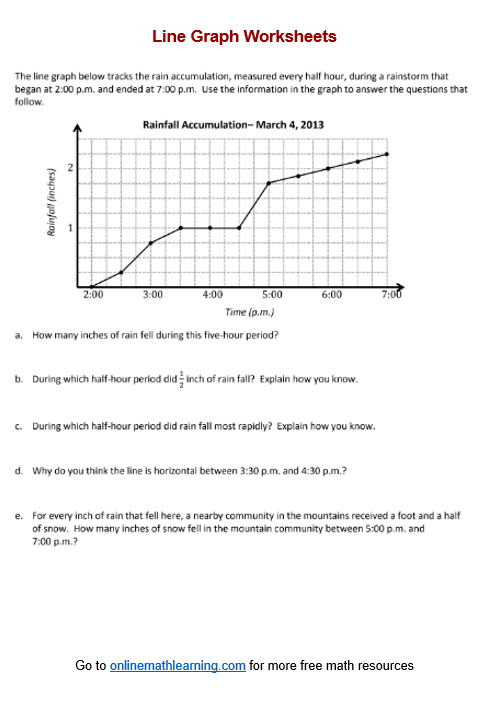
In these free math worksheets, you can practice how to plot data on line graphs and analyze trends.
You can either print the worksheets (pdf) or practice online.
How to plot data on line graphs and analyze trends?
A line graph is a type of chart used to represent data points connected by straight line segments. It is particularly useful for showing trends or changes over time.
Plotting Data on Line Graphs:
- Gather the data you want to visualize on the line graph. Ensure that your data points are ordered, such as by time or another independent variable.
- Decide which variable will be plotted on the x-axis (horizontal) and which will be plotted on the y-axis (vertical). Typically, the x-axis represents time or another independent variable, while the y-axis represents the dependent variable.
- Determine the range and intervals for each axis based on your data. Choose appropriate scales that allow the data to fit comfortably within the graph space.
- Plot each data point on the graph by locating its coordinates (x, y) on the axes. Mark the point with a small dot or symbol.
- Draw straight line segments to connect consecutive data points. This creates a line that visually represents the trend or pattern in the data.
- Label each axis with a descriptive title that indicates what is being measured and the unit of measurement (if applicable).
- Give your graph a title that summarizes the data being represented. This helps viewers quickly understand the purpose of the graph.
Analyzing Trends:
- Examine the line graph to identify any noticeable trends or patterns in the data. Look for upward or downward trends, fluctuations, or periods of stability.
- Interpret the trends in the context of your data and the variables being measured. Consider factors that may influence the observed patterns.
- Analyze the data to draw conclusions or make predictions based on the observed trends. Determine whether the trend is linear, exponential, cyclical, or irregular.
- Compare multiple datasets plotted on the same graph or different graphs to identify similarities or differences in trends. Look for correlations or relationships between variables.
- Use the observed trends to make forecasts or projections about future outcomes. Consider the reliability of the data and any external factors that may impact future trends.
Have a look at this video if you need to review how toplot data on line graphs and analyze trends.
Click on the following worksheet to get a printable pdf document.
Scroll down the page for more Line Graph Worksheets.
More Line Graph Worksheets
Printable
(The answers are on the second page)
Line Graph Worksheet #1
Line Graph Worksheet #2
Line Graph Worksheet #3
Line Graph Worksheet #4
Related Lessons & Worksheets
Try out our new and fun Fraction Concoction Game.
Add and subtract fractions to make exciting fraction concoctions following a recipe. There are four levels of difficulty: Easy, medium, hard and insane. Practice the basics of fraction addition and subtraction or challenge yourself with the insane level.

We welcome your feedback, comments and questions about this site or page. Please submit your feedback or enquiries via our Feedback page.
