Interpret Features of a Function
Related Topics:
Common Core (Functions)
Common Core for Mathematics
Examples, solutions, videos and lessons to help High School students understand how a function models a relationship between two quantities, interpret key features of graphs and tables in terms of the quantities, and sketch graphs showing key features given a verbal description of the relationship.
- Key features include: intercepts; intervals where the function is increasing, decreasing, positive, or negative; relative maximums and minimums; symmetries; end behavior; and periodicity*.
- Distinguish linear, quadratic, and exponential relationships based on equations, tables, and verbal descriptions.
- Given a function in a table or in algebraic or graphical form, identify key features such as x- and y-intercepts; intervals where the function is increasing, decreasing, positive, or negative; relative maximums and minimums; symmetries; and end behavior.
- Use key features of an algebraic function to graph the function.
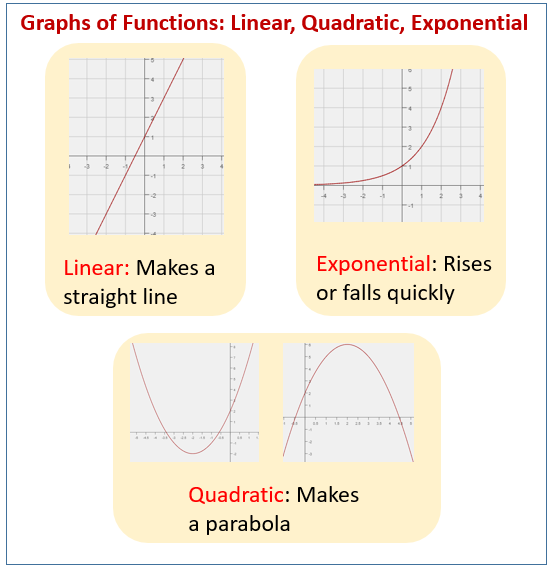
Common Core: HSF-IF.B.4 The following figures show shapes of graphs of linear functions, quadratic functions and exponential functions. Scroll down the page for more examples and solutions.

Interpreting intercepts of linear functions
Example:
After several days of camping and long distance bicycle riding, you decide to ride straight home at a constant rate. After 2 hours of riding, you are 10 km from home and after 4 hours of riding, you are 5 km from home. Once you begin to ride home, in how many hours would you finish your bike ride and arrive at home?
Interpreting features of functions: Interpreting the y-intercept of a graph in context
Example:
Mr. Thelsen is honing his deadly three-point precision on the basketball court. For one of his shots, the height of the ball (in feet) as a function of horizontal distance (in feet), y(x) is plotted below. Mr. Thelsen is standing at x = 0.
What is the significance of the y-intercept of this function?
A. The ball is released from Mr. Thelsen’s hands at a height of 6 feet.
B. Mr. Thelsen is shooting the basketball from 26 feet away.
C. The rim of the basketball hoop is 10 feet high.
D. The maximum height the ball reaches is 10 feet.
Interpreting features of functions (Even Function).
Example:
Cid is experimenting with a piece of sandpaper and some wood. He tries scraping the piece of sandpaper over the wood in different ways to see how much is scraped off. The thickness of wood scarped off (in millimeters) as a function of the speed of the sandpaper (in meters per second), T(v), is shown below.
v > 0 means the sandpaper is moving to the right.
v < 0 means the sandpaper is moving to the left.
The function is even. What is the significance of the evenness of this function?
A. Moving the sandpaper faster scrapes off more wood.
B. The piece of wood is 6 mm thick.
C. Moving the sandpaper to the right has the same effect as moving it to the left.
D. Keeping the sandpaper still doesn’t scrape off any wood.
Interpreting Graphs of Exponential Functions
In this video one is supplied with a real world situation and a graph corresponding to that situation. The graph is then used to answer a series of questions.
Example:
A bacteria population is growing in a Petri dish. The concentration of bacteria per square centimeter is on the vertical axis. The time in hours is on the horizontal axis.
(a) Determine the time when the concentration was 120 bacteria per square centimeter?
(b) Approximate the initial concentration of bacteria.
(c) Approximate the bacteria concentration at t = 3 hours.
(d) How long does it take for the population of bacteria to double in size?
(e) If the graph extended beyond 4 hours, predict the bacteria concentration at t = 6 houre.
(f) State the domain and range.
(g) Is this a growth or decay curve?
Recognizing features of functions
Example:
Which function increases as x increases toward infinity and decreases as x decreases toward negative infinity.
** x and y intercepts of exponential functions**
How to find the x and y intercepts of an exponential function from a graph, equation, and word description?
Examples:
End Behavior of Linear and Exponential Functions
How to find end behaviors of linear and exponential functions from graphs, tables, and equations?
Interpreting Linear Functions (Part 1)
Interpreting graphs of linear functions, including horizontal and vertical asymptotes, and rate of change.
Interpreting Linear Functions (Part 2)
Interpreting graphs of linear functions, including horizontal and vertical asymptotes, and rate of change.
Try out our new and fun Fraction Concoction Game.
Add and subtract fractions to make exciting fraction concoctions following a recipe. There are four levels of difficulty: Easy, medium, hard and insane. Practice the basics of fraction addition and subtraction or challenge yourself with the insane level.

We welcome your feedback, comments and questions about this site or page. Please submit your feedback or enquiries via our Feedback page.