Graphing Linear Inequalities
Related Pages
Graphing Linear Equations
More Geometry Lessons
More Algebra Lessons
In these lessons we will learn
- how to graph linear inequalities.
- how to graph systems of linear inequalities.
We also have a systems of inequalities calculator that can display the shaded region that satisfies all the given inequalities.
Graphing Linear Inequalities
In the following diagram, all the points above the line y = 1 are represented by the inequality y > 1. All the points below the line are represented by the inequality y < 1. The representation is clearer if you look at what the y-coordinates of these points have in common.
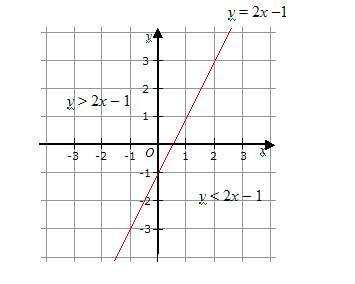
In the diagram below, the region above the line is represented by y > 2x –1 and the region below the line is represented by y < 2x – 1.
Example:
By shading the wanted region, show the region represented by the inequality 2x – 3y ≥ 6
Solution:
First, we need to draw the line 2x – 3y = 6.
We will revise the method for drawing a straight line.
Rewrite the equation in the form y = mx + c.
From the equation* m* will be the gradient and c will be the y-intercept.
2x – 3y = 6
y = ![]() x – 2
x – 2
The gradient is then ![]() and the y-intercept is – 2.
and the y-intercept is – 2.
If the inequality is „ or … then we draw a solid line. If the inequality is < or > then we draw a dotted line.
After drawing the line, we need to shade the unwanted region.
Rewrite the inequality 2x – 3y ≥ 6 as y ≤ ![]() x – 2. Since the inequality is ≤ , the wanted region is below the line. We shade below the line.
x – 2. Since the inequality is ≤ , the wanted region is below the line. We shade below the line.
Example:
By shading the unwanted region, show the region represented by the inequality x + y < 1
Solution:
Rewrite the equation x + y = 1in the form y = mx + c.
x + y = 1 can be written as y = –x + 1
The gradient is then –1 and the y-intercept is 1.
We need to draw a dotted line because the inequality is <.
After drawing the dotted line, we need to shade the unwanted region.
Rewrite the inequality x + y < 1 as y < –x + 1. Since the inequality is < , the wanted region is below the line and so the unwanted region is above the line. We shade above the line.
Note: A question may require you to shade the wanted region or the unwanted region. If the question does not specify which region to shade, then state which region you are shading. While it may seem to be more intuitive to shade the wanted region here, shading the unwanted region is more useful in linear programming.
How to graph a linear inequality?
Example:
Graph the following inequality
2x - 3y ≤ 12
How to graph linear inequalities?
The skills used in graphing linear inequalities are basically the same as those needed for graphing linear functions.
There are, however, some few key differences.
- Draw the graph by marking a point at the y-intercept.
- Use a dashed line when the inequality symbol is either < or >. It is a dashed line because the points on the boundary line are not part of the solution set.
- Use a solid line if the symbol is either ≤ or ≥ to indicate that the line contains part of the solution set.
- Mark which side of the drawn boundary line contains the solutions by shading either above or below the line.
- Test the solution by substituting one of the points into the solution.
Examples:
Graph
a) y ≤ 2x - 3
b) 3x + 5y > 15
c) 5x - 2y ≥ 20
d) -1/2x - 1/3y ≤ -2
Graphing Systems of Linear Inequalities
Example:
By shading the unwanted regions, show the region defined by the set of inequalities y < 2x + 5, y ≥ x , and x < 4.
Solution:
Draw the lines for each of the inequalities and shade the unwanted region for each of them.
How to graph systems of linear inequalities?
Example:
y ≥ 2x + 1
y < -x + 4
Examples:
2x + 4y < 6
x - y > 2
x ≥ 0
y ≥ 0
Graphing systems of inequalities
Example:
y ≥ 1/2 x - 1
y < 3x + 1
Solving Systems of Linear Inequalities
Example:
y > -3x + 4
2x + 3y ≥ 12
Systems of Inequalities Calculator
This tool will show the shaded region that satisfies all the given inequalities.
Try out our new and fun Fraction Concoction Game.
Add and subtract fractions to make exciting fraction concoctions following a recipe. There are four levels of difficulty: Easy, medium, hard and insane. Practice the basics of fraction addition and subtraction or challenge yourself with the insane level.

We welcome your feedback, comments and questions about this site or page. Please submit your feedback or enquiries via our Feedback page.