Frequency Tables: Examples
These lessons help High School students learn how to use the frequency table to organize data, with video lessons, examples and solutions.
Related Pages
Mean And Mode From The Frequency Table
Median From The Frequency Table
Histograms
More Statistics Lessons
In a survey, people usually collect lots of data, also known as raw data. Raw data can be arranged in a frequency table.
A frequency table shows the number of times each value occurs. The mode is the data with the highest frequency.
Example:
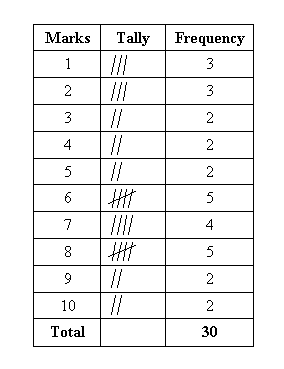
The following data shows the test marks obtained by a group of students.
Draw a frequency table for the data and find the mode.
| 6 | 7 | 7 | 1 | 3 | 2 | 8 | 6 | 8 | 2 |
| 4 | 4 | 9 | 10 | 2 | 6 | 3 | 1 | 6 | 6 |
| 9 | 8 | 7 | 5 | 7 | 10 | 8 | 1 | 5 | 8 |
Solution:
Go through the data; make a stroke in the tally column for each occurrence of the data. The number
of strokes will be the frequency of the data.

The mode is 6 and 8 since they both have the highest frequency of 5.
Creating a Frequency Table
This video describes how the following are obtained:
mean from frequency table, mean from frequency table with intervals,
mode from frequency table and median from frequency table
Try out our new and fun Fraction Concoction Game.
Add and subtract fractions to make exciting fraction concoctions following a recipe. There are four levels of difficulty: Easy, medium, hard and insane. Practice the basics of fraction addition and subtraction or challenge yourself with the insane level.

We welcome your feedback, comments and questions about this site or page. Please submit your feedback or enquiries via our Feedback page.