Variance
Related Pages
Central Tendency & Variance
Standard Deviation
Statistics Lectures - 5: Variance & Percentiles
ANOVA Test
More Statistics Lessons
In these lessons, we will learn
- Population Variance
- Sample Variance
- Alternate Formulas or Computational Formulas for Variance
In statistics, variance is a measure of the spread or dispersion of a set of data points around their mean (average) value. It tells you how much individual data points deviate from the average.
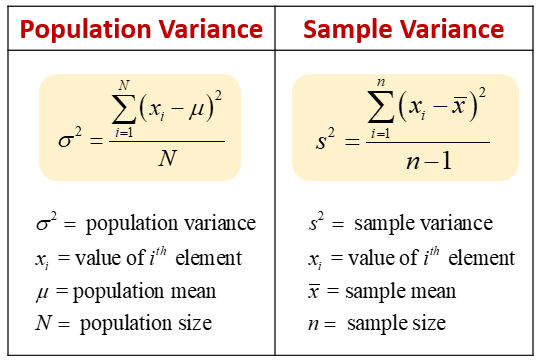
The following diagrams give the population variance formula and the sample variance formula. Scroll down the page for more examples and solutions on how to use the variance formulas.

Statistics Worksheets
Practice your skills with the following worksheets:
Printable & Online Statistics Worksheets
Population Variance
The variance is the average of the squared deviations about the mean for a set of numbers. The population variance is denoted by σ2. It is given by the formula:

The capital Greek letter sigma 𝚺 is commonly used in mathematics to represent a summation of all the numbers in a grouping.
N is the number of terms in the population.
Steps to calculate population variance:
- Calculate the mean (μ) of the data set.
- Subtract the mean from each data point (xi − μ).
- Square each of these differences (xi − μ)2.
- Sum all the squared differences ∑(xi − μ)2.
- Divide the sum by the total number of data points (N).
How To Calculate The Variance Of A Population?
Variance as a measure of, on average, how far the data points in a population are from the population mean.
Population Variance And Standard Deviation
How to calculate the variance and standard deviation?
Sample Variance
The sample variance is denoted by s2. The main use for sample variances is as estimators of population variances. The computation of the sample variance differs slightly from computation of the population variance. The sample variance uses n – 1 in the denominator instead of n because using n in the denominator of a sample variance results in a statistic that tends to underestimate the population variance. (This is further explained in the video below)
The formula for sample variance is:

Steps to calculate sample variance:
- Calculate the mean (\(\bar{x}\)) of the sample data set.
- Subtract the mean from each data point (xi − \(\bar{x}\)).
- Square each of these differences (xi − \(\bar{x}\))2.
- Sum all the squared differences ∑(xi − \(\bar{x}\))2.
- Divide the sum by one less than the total number of data points in the sample (n−1).
How to use the variance of a sample to estimate the variance of a population?
What is the formula of sample variance and how to finding the sample variance?
Interpretation of Variance in Data Analysis
- High Variance:
a) Indicates that data points are widely spread out from the mean.
b) Suggests greater variability, inconsistency, or a wider range of values within the data.
c) In fields like finance, high variance in returns might indicate higher risk or volatility.
d) In manufacturing, high variance in product dimensions might indicate a less precise process. - Low Variance:
a) Indicates that data points are tightly clustered around the mean.
b) Suggests less variability, more consistency, or a narrow range of values.
c) In finance, low variance might suggest a more stable or predictable investment.
d) In manufacturing, low variance suggests a more consistent and controlled process. - Comparison: Variance is particularly useful for comparing the spread of two or more different data sets, especially when their means are similar. A data set with a higher variance is more spread out than a data set with a lower variance.
- Basis for Other Statistics: Variance is a crucial component in many other statistical calculations and tests, such as standard deviation (its square root), ANOVA (Analysis of Variance), and regression analysis.
- Sensitivity to Outliers: Because deviations are squared, outliers (extreme values) have a disproportionately larger impact on variance, pulling its value up significantly.
Alternate Formulas Or Computational Formulas For Variance
Sometimes, books may give different formulas for variance.

We will now show how to derive these different formulas for variance.

How to derive the different alternate formulas for variance?
How to find the sample standard deviation using the computation formula?
Try out our new and fun Fraction Concoction Game.
Add and subtract fractions to make exciting fraction concoctions following a recipe. There are four levels of difficulty: Easy, medium, hard and insane. Practice the basics of fraction addition and subtraction or challenge yourself with the insane level.

We welcome your feedback, comments and questions about this site or page. Please submit your feedback or enquiries via our Feedback page.