

Statistics - Grade 5
In these lessons, we will learn how to differentiate between first-hand and second-hand data. We will learn how to draw and interpret double bar graphs.
First-Hand Data and Second-Hand Data
Differentiate between first-hand and second-hand data.
First-hand data is data that you collect yourself.
Second-hand data is data that is collected by someone else.
First-Hand Data
• Data collected by the researcher (in school, this is the student)
• Observations, surveys, experiments
• Student primary source
• Questions created should help give more precise answers
Second-Hand Data
• Data collected by others and used for secondary analysis
• Found in news, Internet, statistics
• Student not part of data collections or questioning
• Can create questions based on data
First hand vs second hand data.
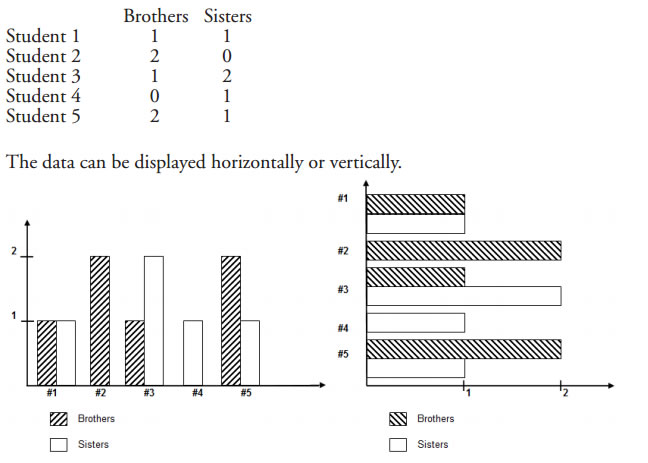
Double Bar Graph
A double bar graph is best used to show how two sets of data are
different or alike.
In a double bar graph:
• Each set of data must use the same scale
• All graphs must have a title, scale and legend.
• The order of colors must remain the same throughout.
An example is presented below. Five students in the
class have been asked how many brothers and sisters they have.
Drawing double bar graphs
Interpreting double bar graphs.
Double Bar Graphs.
Double Bar Graphs
Learn to make and interpret double bar graphs.
Check out our most popular games!
Fraction Concoction Game:
Master fractions in the lab: mix, add, and subtract beakers to create the perfect concoction!

Fact Family Game:
Complete fact families and master the link between addition & subtraction and multiplication & division.

Number Bond Garden:
Clear the board by matching number pairs that sum to ten in this garden-themed mental math puzzle.

Online Addition Subtraction Game:
Practice your addition and subtraction skills to help the penguin find its mummy.

We welcome your feedback, comments and questions about this site or page. Please submit your feedback or enquiries via our Feedback page.