
Graphing Quadratic Functions
Related Topics:
More Lessons for Geometry
More Lessons for Algebra
Math Worksheets
In this lesson, we shall learn
Step 2 : Plot the points on the graph.
Step 3 : Draw a smooth curve passing through the points.
From the example above, you may have noticed the following properties.
Refer to the following diagram when you study these properties.
1. The graphs of y = ax2 (a ≠ 0) pass through the origin (0, 0).
2. The y-axis is the line of symmetry
3. (a) When a is positive, each graph has a lowest point (origin) and opens upwards. This point is known as the minimum point.
(b) The smaller the value of a, the wider the graph opens.
4. (a) When a is negative, each graph has a highest point (the origin) and opens downwards. This point is known as the maximum point.
(b) The smaller the value of |a|, the wider the graph opens.
How to Graph Quadratic Functions given in General Form? Graphing Quadratic Functions
This video outlines a little recipe of things to examine when graphing a quadratic function by hand. An example of graphing a quadratic function is also shown
Graphing Parabolas in Factored Form y = a(x − r)(x − s) Graphing a Quadratic Function in Factored Form
Graphs of parabolas in Factored Form
If you have a quadratic in factored form, it is easy to see when it crosses the x-axis. You can also see the shape of the curve, which allows you to get the vertex quickly.
y = a(x − h)2 + k where a, h and k are real numbers and a is not equal to zero.
We can convert quadratic functions from general form to vertex form or factored form.
How to Graph Quadratic Functions given in Vertex Form? Graphing Quadratic Functions in Standard Form
The vertex form is also sometimes called the standard form.
This video explains how to graph quadratic functions in the form y = a(x - h)2 + k.


More Lessons for Geometry
More Lessons for Algebra
Math Worksheets
In this lesson, we shall learn
- how to graph of quadratic functions by plotting points
- how to graph quadratic function of the form y = ax2
- the properties of the graph y = ax2
- how to graph a quadratic function given in general form.
- how to graph a quadratic function given in factored form.
- how to graph a quadratic function given in vertex form.
Quadratic Graphs Of The Form y = ax2 ( a ≠ 0 )
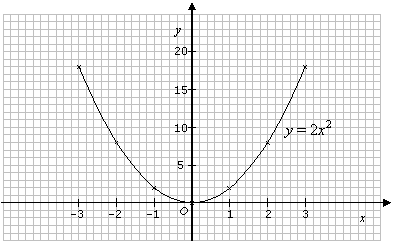
Example:Draw the graph of y = 2x2 for ≤ x ≤ 3, using a scale of 1 cm to 1 unit on the x-axis and 1 cm to 5 units on the y-axis.
Solution:
Step 1 : Construct the table of values.
x |
–3 |
–2 |
–1 |
0 |
1 |
2 |
3 |
y |
18 |
8 |
2 |
0 |
2 |
8 |
18 |
Step 3 : Draw a smooth curve passing through the points.

The properties of quadratic graphs y = ax2
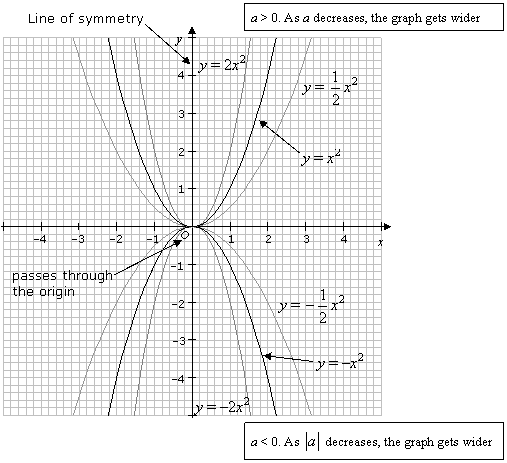
The curves of the functions you have drawn so far are called parabolas.From the example above, you may have noticed the following properties.
Refer to the following diagram when you study these properties.
1. The graphs of y = ax2 (a ≠ 0) pass through the origin (0, 0).
2. The y-axis is the line of symmetry
3. (a) When a is positive, each graph has a lowest point (origin) and opens upwards. This point is known as the minimum point.
(b) The smaller the value of a, the wider the graph opens.
4. (a) When a is negative, each graph has a highest point (the origin) and opens downwards. This point is known as the maximum point.
(b) The smaller the value of |a|, the wider the graph opens.

Activity to Explore the Graph of a Quadratic Equation
Graphing Quadratic Functions in General Form
The general form of a quadratic equation is y = ax2 + bx + c where a, b and c are real numbers and a is not equal to zero.How to Graph Quadratic Functions given in General Form? Graphing Quadratic Functions
This video outlines a little recipe of things to examine when graphing a quadratic function by hand. An example of graphing a quadratic function is also shown
Graphing Quadratic Functions in Factored Form
The general form of a quadratic equation isy = a(x + b)(x + c) where a, b and c are real numbers and a is not equal.Graphing Parabolas in Factored Form y = a(x − r)(x − s) Graphing a Quadratic Function in Factored Form
Graphs of parabolas in Factored Form
If you have a quadratic in factored form, it is easy to see when it crosses the x-axis. You can also see the shape of the curve, which allows you to get the vertex quickly.
Graphing Quadratic Functions in Vertex Form
The vertex form of a quadratic equation isy = a(x − h)2 + k where a, h and k are real numbers and a is not equal to zero.
We can convert quadratic functions from general form to vertex form or factored form.
How to Graph Quadratic Functions given in Vertex Form? Graphing Quadratic Functions in Standard Form
The vertex form is also sometimes called the standard form.
This video explains how to graph quadratic functions in the form y = a(x - h)2 + k.
Try out our new and fun Fraction Concoction Game.
Add and subtract fractions to make exciting fraction concoctions following a recipe. There are four levels of difficulty: Easy, medium, hard and insane. Practice the basics of fraction addition and subtraction or challenge yourself with the insane level.


We welcome your feedback, comments and questions about this site or page. Please submit your feedback or enquiries via our Feedback page.