Inequalities on a Number Line
Related Pages
More Lessons for Grade 8 Math
Math Worksheets
Examples, solutions, videos, and worksheets to help Grade 8 students learn how to graph inequalities on a number line.
Graphing inequalities on a number line is a visual way to represent all the possible solutions to an inequality.
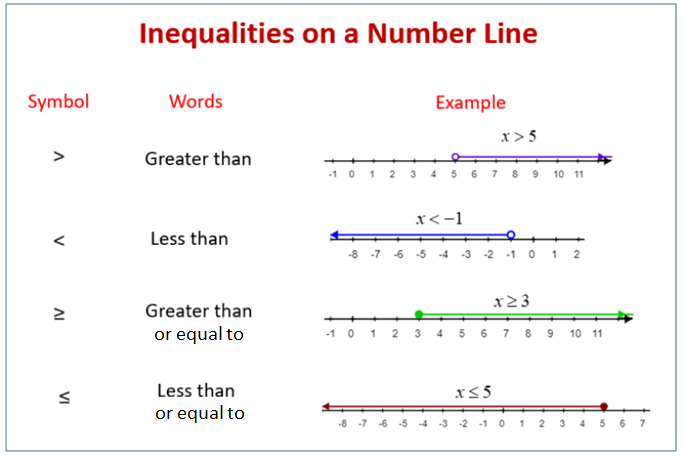
The following diagram shows how inequalities can be represented on the number line. Scroll down the page for more examples and solutions on how to graph inequalities on a number line.

Algebra Worksheets
Practice your skills using the following worksheets:
Printable & Online Algebra Worksheets
-
Understand the Inequality Symbols and Their Representation:
< (Less than): The solution set includes all numbers smaller than the given value, but not including the value itself. Represented by an open circle on the number line.
> (Greater than): The solution set includes all numbers larger than the given value, but not including the value itself. Represented by an open circle on the number line.
≤ (Less than or equal to): The solution set includes all numbers smaller than or equal to the given value. Represented by a closed (filled-in) circle on the number line.
≥ (Greater than or equal to): The solution set includes all numbers larger than or equal to the given value. Represented by a closed (filled-in) circle on the number line. -
Draw a Number Line:
Draw a straight horizontal line.
Mark the relevant number(s) from your inequality on the number line. It’s usually helpful to include a few numbers on either side of your critical value(s) for context. -
Plot the Critical Point(s) with the Correct Circle Type:
Locate the number that the inequality is comparing the variable to (your critical point).
If the inequality is < or >: Draw an open circle at this number. This signifies that the number itself is not part of the solution.
If the inequality is ≤ or ≥: Draw a closed (filled-in) circle at this number. This signifies that the number itself is part of the solution. -
Draw a line to represent the Solution Set:
For < or ≤ (less than): Draw a line to the left of your circle. This indicates that all numbers to the left (smaller values) are solutions.
For > or ≥ (greater than): Draw a line to the right of your circle. This indicates that all numbers to the right (larger values) are solutions.
Use an arrow at the end of your line to show that the solutions continue infinitely in that direction.
Inequalities on a number line
Graphing an Inequality on a Number Line
How to Graph an Inequality on a Number Line?
Graphing Inequalities
This video covers graphing simple inequalities. It includes three examples.
Try out our new and fun Fraction Concoction Game.
Add and subtract fractions to make exciting fraction concoctions following a recipe. There are four levels of difficulty: Easy, medium, hard and insane. Practice the basics of fraction addition and subtraction or challenge yourself with the insane level.

We welcome your feedback, comments and questions about this site or page. Please submit your feedback or enquiries via our Feedback page.