Graphing Systems of Inequalities
Examples, solutions, videos, worksheets, games and activities to help Algebra students learn how to graph systems of linear inequalities.
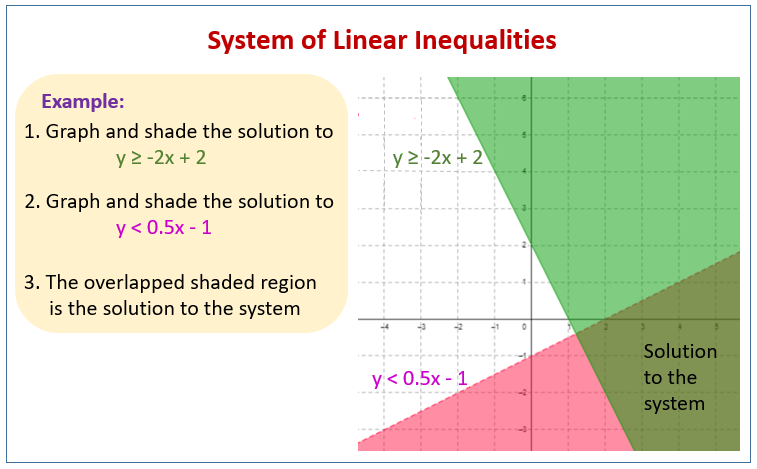
The following diagrams show how to graph a system of linear inequalities. Scroll down the page for more examples and solutions on graphing systems of linear inequalities.

System of Linear Inequalities
Steps to graphing the solution to a System of Linear Inequalities
- Graph and shade the solution to the first linear inequality.
- Graph and shade the solution to the second linear inequality.
- The region that is double shaded is the solution to the system.
Examples:
Graph the solution - x > -4, y ≤ 2
- y < -x + 2, y ≥ 3x - 4
- x - 2y ≤ 4, x - 2y > 4
Graphing Systems of Linear Inequalities
Example:
y ≥ 2x + 1
y < -x + 4
Graphing Systems of Linear Inequalities
Example:
2x + 4y < 6
x - y > 2
x ≥ 0
y ≥ 0
Graphical System of Inequalities
Example:
Graph the solution set for the system
y > x - 8
y < 5 - x
Solving Two Inequalities Graphically
This video demonstrates how to solve a system of inequalities graphically.
Example:
y ≥ x
y ≤ -x + 6
Try out our new and fun Fraction Concoction Game.
Add and subtract fractions to make exciting fraction concoctions following a recipe. There are four levels of difficulty: Easy, medium, hard and insane. Practice the basics of fraction addition and subtraction or challenge yourself with the insane level.

We welcome your feedback, comments and questions about this site or page. Please submit your feedback or enquiries via our Feedback page.