

Graphing Linear Inequalities
Related Topics:
More Algebra Lessons
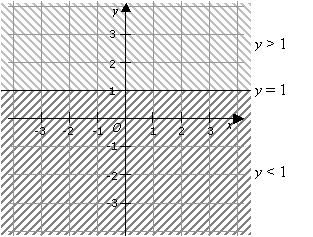
In the following diagram:
All the points above the line y = 1 are represented by the inequality y > 1.
All the points below the line are represented by the inequality y < 1.
The representation is clearer if you look at what the y-coordinates of these points have in common.
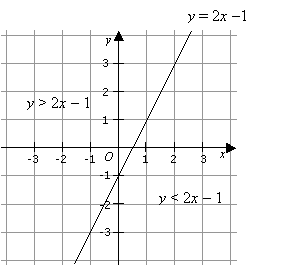
In the diagram below, the region above the line is represented by y > 2x –1 and the region below the line is represented by y < 2x – 1.
Example:
Show the region represented by the inequality 2x – 3y ≥ 6
Solution:
First, we need to draw the line 2x – 3y = 6.
We will revise the method for drawing a straight line.
Rewrite the equation in the form y = mx + c.
From the equation m will be the gradient and c will be the y-intercept.
2x – 3y = 6 ⇒ y = ![]() x – 2
x – 2
The gradient is then ![]() and the y-intercept is – 2.
and the y-intercept is – 2.
If the inequality is ≤ or ≥ then we draw a solid line. If the inequality is < or > then we draw a dotted line.
After drawing the line, we need to shade the region.
We pick a point not on the line, for example (0, 0). We substitute (0, 0) into the inequality 2x – 3y ≥ 6 and finds that it is false. So, we shade the opposite side of the line.
The following diagram shows how to graph the linear inequality 2x - 3y ≥ 6. Scroll down the page for more examples of graphing linear inequalities.
Example:
Show the region represented by the inequality x + y < 1
Solution:
Rewrite the equation x + y = 1in the form y = mx + c.
x + y =1 ⇒ y = –x + 1
The gradient is then –1 and the y-intercept is 1.
We need to draw a dotted line because the inequality is <.
After drawing the dotted line, we need to shade the region.
We pick a point not on the line, for example (0, 0). We substitute (0, 0) into the inequality x + y > 1 and finds that it is false. So, we shade the opposite side of the line.

Steps to graphing inequalities
1. Rewrite inequality in slope-intercept form.
2. Determine whether to use a solid or a dashed line.
3. Determine whether to shade above or below the line.
Example:
Graph the following inequalities:
a) 2x + 4y ≥ 16
b) y + 1 < 2x
c) y ≥ -1/2 x + 3
d) 5x + 3y > 9
e) y < -4
Graphing Linear Inequalities
In this lesson, you will learn to graph inequalities in two variables.
For example, to graph y > -4x -3, the first step is to graph the boundary line y = -4x -3.
Note that greater than or less than means that the boundary line will be dotted, and greater than or equal to or less than or equal to means that the boundary line will be solid.
To determine which side of the boundary line to shade, substitute a test point, such as (0, 0), into the original inequality, y > -4x -3. Since (0) is greater than (0) -3, or 0 is greater than -3, is a true statement, the side of the line that contains the point (0, 0) is shaded. Examples of graphing linear inequalities
Example:
Graph the following inequality:
y < -3x + 5
Example:
Graph the following inequality:
2x - 3y ≤ 12
Check out our most popular games!
Fraction Concoction Game:
Master fractions in the lab: mix, add, and subtract beakers to create the perfect concoction!

Fact Family Game:
Complete fact families and master the link between addition & subtraction and multiplication & division.

Number Bond Garden:
Clear the board by matching number pairs that sum to ten in this garden-themed mental math puzzle.

Online Addition Subtraction Game:
Practice your addition and subtraction skills to help the penguin find its mummy.

We welcome your feedback, comments and questions about this site or page. Please submit your feedback or enquiries via our Feedback page.