Graphing Linear Inequalities on a Number Line
Related Topics:
More Lessons for Grade 8 Math
Math Worksheets
Examples, solutions, videos, worksheets, and lessons to help Grade 8 students learn about solving and graphing linear inequalities on a number line.
Graphing linear inequalities on a number line is a visual way to represent all the real numbers that satisfy the inequality.
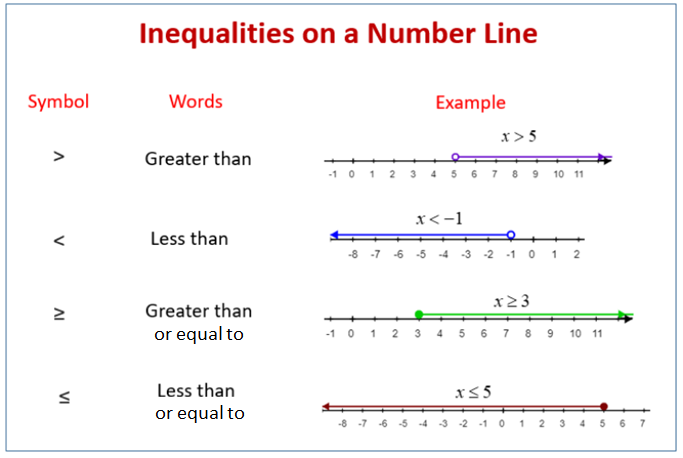
The following diagram shows how inequalities can be represented on the number line. Scroll down the page for more examples and solutions on how to graph inequalities on the number line.

Algebra Worksheets
Practice your skills with the following Algebra worksheets:
Printable & Online Algebra Worksheets
Key Rules for Graphing Inequalities
Open Circle (○):
Used for < (less than) or > (greater than).
The number is not included in the solution.
Closed Circle (●):
Used for ≤ (less than or equal to) or ≥ (greater than or equal to).
The number is included in the solution.
Arrow Direction:
Points to the right for > or ≥
Points to the left for < or ≤.
Graphing Inequalities on a Number Line
Graph the following inequalities on a number line<br
3x + 2 > 5
x - 5 ≤ 6
2/3 x + 4 ≥ 5
-4x + 2 ≤ 10
-x/3 + 1 > 4
2x - 8 < 0
Solving and Graphing Linear Inequalities on a number line
3x - 4 ≤ 10
-2/3 x ≤ 2
Solving and Graphing Linear Inequalities on a number line
7x - 4 < 3x
15 - 5(3 - 2x) ≥ 4(x - 3)
Try out our new and fun Fraction Concoction Game.
Add and subtract fractions to make exciting fraction concoctions following a recipe. There are four levels of difficulty: Easy, medium, hard and insane. Practice the basics of fraction addition and subtraction or challenge yourself with the insane level.

We welcome your feedback, comments and questions about this site or page. Please submit your feedback or enquiries via our Feedback page.