Tangent Graphs
Related Pages
Trigonometric Graphs
Trigonometric Functions
Lessons On Trigonometry
In these lessons, we will look at graphing the tangent function.
Unit Circle
We will start with the unit circle.
A unit circle is a circle of radius one unit with its center at the origin (0, 0) of a coordinate plane.It’s a powerful visual tool for understanding trigonometric functions, including the tangent.
Tangent as a Line Segment
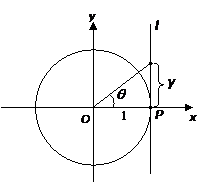
Imagine a vertical line drawn tangent to the unit circle at the point (1,0).
- For any angle θ, extend the terminal side of the angle (the radius) beyond the unit circle until it intersects this vertical tangent line at x=1.
- The y-coordinate of this intersection point on the tangent line is the value of tan(θ).
In the following diagram, the line l is a tangent to the unit circle at point P(1,0).

We can see that:
y = tan θ is known as the tangent function.
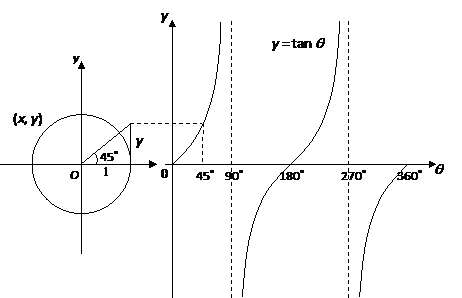
Using the unit circle, we can plot the values of y against the corresponding values of θ.
The graph of y = tan θ, for 0˚ ≤ θ ≤ 360˚ obtained is as shown:

Explore the following interactive activity to relate the unit circle and the tangent graph
Properties of the tangent function:
- The curve is not continuous. It breaks at θ = 90˚ and 270˚, where the function is undefined
- tan θ = 0 when θ = 0˚, 180˚, 360˚. tan θ = 1 when θ = 45˚ and 225˚.
- tan θ = –1 when θ = 135˚ and 315˚.
- tan θ does not have any maximum or minimum values. The range of values of tan θ is –∞ < tan θ < ∞ .
- As the point P moves round the circle in either the clockwise or anticlockwise direction, the tangent curve above repeats itself for every interval of 180˚. Its period is 180˚.
Example:
Sketch the graph of y = tan x for 0˚ ≤ x ≤ 360˚.
Solution:
Set up a table of values for y = tan x
| x | 0 |
45 |
90 |
135 |
180 |
225 |
270 |
315 |
360 |
tan x |
0 |
1 |
undefined |
–1 |
0 |
1 |
undefined |
–1 |
0 |
Plot the points and join with a smooth curve.

Example:
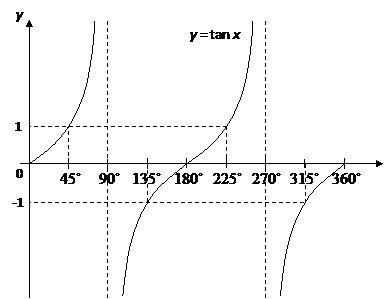
The diagram shows a graph of y = tan x for 0˚ ≤ x ≤ 360˚, determine the values of p, q and r.

Solution:
We know that for a tangent graph, tan θ = 1 when θ = 45˚ and 225˚. So, b = 45˚.
We know that for a tangent graph, tan θ = 0 when θ = 0˚, 180˚ and 360˚. So, c = 180˚.
Videos
Graphing the Tangent Function
Demonstrates how to graph the tangent function using the unit circle.
Graphing the Tangent Function
How to graph the tangent function on the coordinate plane using the unit circle.
How to determine the domain and range of the tangent function.
The name of the tangent function comes from the tangent line that is perpendicular to the radius and intersects the circle at a single point.
To create a tangent segment, draw a line perpendicular to the x-axis and then extend θ so it intersects the tangent line. The tangent function is defined as the length of the red segment.
- The domain is {x|x ≠ (2n+1)(π/2)}, Range is (-∞, ∞)
- The graph is discontinuous and has vertical asymptotes.
- The x-intercepts occur at x = nπ
- The period is π
- The graph has no amplitude.
- The graph is symmetric with respect to the origin. Therefore, the function is an odd function.
Graph a Transformation of the Tangent Function (Period and Horizontal Shift)
y = A tan (B(x - D)) + C
- Tangent has no amplitude.
- π/B is the period.
- C is the vertical translation.
- D is the horizontal translation.
Example:
y = 3 tan (2x + π/2)
- Find the period of the function.
- Find the horizontal shift.
- Graph the function.
Try out our new and fun Fraction Concoction Game.
Add and subtract fractions to make exciting fraction concoctions following a recipe. There are four levels of difficulty: Easy, medium, hard and insane. Practice the basics of fraction addition and subtraction or challenge yourself with the insane level.

We welcome your feedback, comments and questions about this site or page. Please submit your feedback or enquiries via our Feedback page.