Pictograms/Pictographs
In these lessons you will learn what pictograms are, how to draw them and how to read them.
Related Pages
Pictographs
Bar Graphs
A pictogram or pictograph represents the frequency of data as pictures or symbols. Each picture or symbol may represent one or more units of the data.
Example:
The following table shows the number of computers sold by a company for the months January to March.
Construct a pictograph for the table.
| Month | January | February | March |
| Number of computers | 25 | 35 | 20 |
Solution:

Example:
The following pictograph shows the number of students using the various types of transport to go to school.
| Walking | |
| Bus | |
| Bicycle | |
| Car |
![]()
a) How many students go to school by car?
b) If the total number of students involved in the survey is 56 how many symbols must be drawn for the students walking to school?
c) What is the percentage of students who cycle to school?
Solution:
a) 20 students
b) 56 students should be represented by 56 ÷ 4 = 14 symbols.
There are already 11 symbols on the table.
So, the number of symbols to be added for ‘Walking’ is 14 – 11 = 3
![]()
Example:
The pictograph shows the number of canned drinks sold by three different shops in a week.
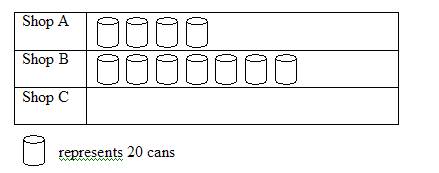
a) What is the total profit of shop A, if the profit gained on each drink is 50 cents?
b) If the total number of cans sold is 180 how many symbols must be drawn for shop C?
c) What is the difference between the number of cans sold by shop B and the number of cans sold by shop C?
Solution:
a) Total profit of shop A= 20 × 4 × 0.5 = $40
b) 9 symbols must be drawn for shop C. (9 × 20 = 180)
c) Difference between shop B and shop C = 20 × 2 = 40 cans
Picture Graphs or Pictographs
A pictograph is a graph that compares categories to each other using pictures.
This video explains how to read and interpret a pictograph.
Reading Pictographs
According to the pictograph below, how may survey respondents have type O+ blood? How many have O- blood?
Pictographs and Line Plots
The following video how to create line plots or pictographs using given data, and answer questions based on given line plots or pictographs.
Example:
Make a line plot of the data below. Find the most common number and the range of the data.
Try out our new and fun Fraction Concoction Game.
Add and subtract fractions to make exciting fraction concoctions following a recipe. There are four levels of difficulty: Easy, medium, hard and insane. Practice the basics of fraction addition and subtraction or challenge yourself with the insane level.

We welcome your feedback, comments and questions about this site or page. Please submit your feedback or enquiries via our Feedback page.