Venn Diagrams
Related Pages
Part 2 Of These Lessons
More Lessons On Sets
Intersection Of Two Sets
Intersection Of Three Sets
GCSE Maths
Venn diagrams are the principal way of showing sets in a diagrammatic form. It is used to illustrate the relationships between sets. The method consists primarily of entering the elements of a set into a circle or ovals.
What is a Venn Diagram?
A Venn diagram is a visual tool that illustrates the logical relationships between sets, groups, or concepts. It uses overlapping circles to represent sets, with the areas of overlap showing elements common to those sets, and non-overlapping areas showing elements unique to each set.
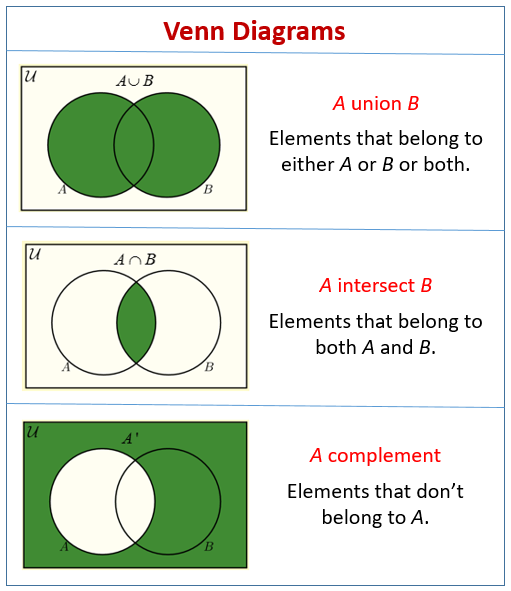
The following diagrams show how to use Venn Diagrams to represent Union, Intersection and Complement. Scroll down the page for more examples and solutions on how to use Venn Diagrams.

Sets:
In mathematics, a set is a collection of distinct objects. In Venn diagrams, these sets are typically represented by circles.
Common Set Operations in Venn Diagrams
- Union (A ∪ B): Represents all elements that belong to Set A, Set B, or both. This includes the entire area covered by the two circles.
- Intersection (A ∩ B): Represents elements that belong to both Set A and Set B. This is the overlapping region of the two circles.
- Complement (A’): Represents elements that do not belong to Set A. This is the area outside the circle for Set A but within the universal set.
Videos
What’s A Venn Diagram, And What Does Intersection And Union Mean?
Venn Diagrams: Shading Regions for Two Sets
Drawing and reading Venn diagrams with two sets.
How to Draw a Venn Diagram
- Identify the Sets: Determine the sets you want to represent (e.g., Set A, Set B, Set C).
- Draw the Circles: Draw overlapping circles within a rectangle (universal set). Ensure the circles overlap appropriately to show all possible relationships.
- Label the Diagram: Label each circle with the name of the set it represents.
- Fill in the Data: For multiple sets, always fill in the most central intersection first, and work your way outwards.
Try out our new and fun Fraction Concoction Game.
Add and subtract fractions to make exciting fraction concoctions following a recipe. There are four levels of difficulty: Easy, medium, hard and insane. Practice the basics of fraction addition and subtraction or challenge yourself with the insane level.

We welcome your feedback, comments and questions about this site or page. Please submit your feedback or enquiries via our Feedback page.