Illustrative Mathematics Grade 7, Unit 5, Lesson 2: Changing Temperatures
Learning Targets:
- I can use a number line to add positive and negative numbers.
Related Pages
Illustrative Math
Grade 7
Lesson 2: Changing Temperatures
Let’s add signed numbers.
Illustrative Math Unit 7.5, Lesson 2 (printable worksheets)
Lesson 2 Summary
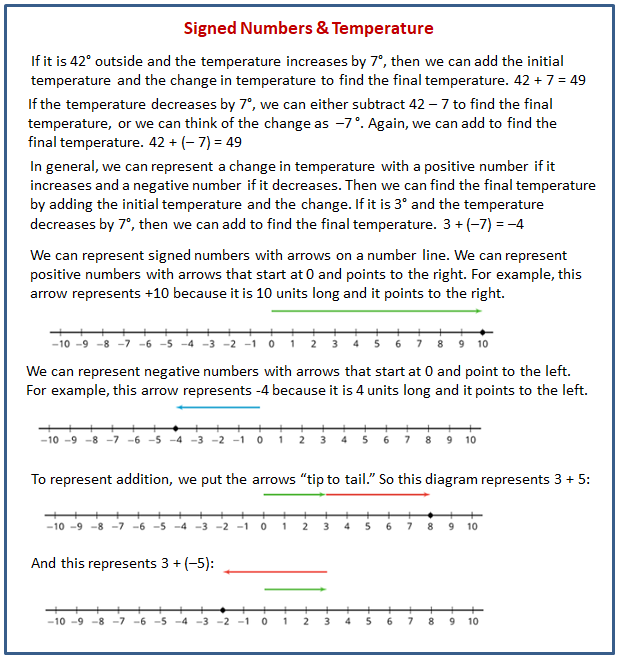
The following diagram shows how to relate signed numbers to changing temperatures and how to use a number line to add positive and negative numbers.

Lesson 2.1 Which One Doesn’t Belong: Arrows
Which pair of arrows doesn’t belong?
Lesson 2.2 Warmer and Colder
- Complete the table and draw a number line diagram for each situation.
- Complete the table and draw a number line diagram for each situation.
Are you ready for more?
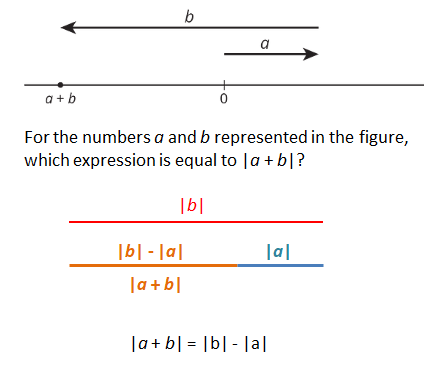
For the numbers a and b represented in the figure, which expression is equal to |a + b|?
Lesson 2.3 Winter Temperatures
- One winter day, the temperature in Houston is 8° Celsius. Find the temperatures in these other cities. Explain or show your reasoning.
a. In Orlando, it is warmer than it is in Houston.
b. In Salt Lake City, it is colder than it is in Houston.
c. In Minneapolis, it is colder than it is in Houston. - In Fairbanks, it is colder than it is in Minneapolis. What is the temperature in Fairbanks?
- Use the thermometer applet to verify your answers and explore your own scenarios. See Applet
Lesson 2 Practice Problems
- a. The temperature is -2°C. If the temperature rises by 15°C, what is the new temperature?
b. At midnight the temperature is -6°C. At midday the temperature is 9°C. By how much did the temperature rise? - Complete each statement with a number that makes the statement true.
- Draw a diagram to represent each of these situations. Then write an addition expression that represents the final temperature.
a. The temperature was 80°F and then fell 20°F.
b. The temperature was -13°F and then rose 9°F.
c. The temperature was -5°F and then fell 8°F. - Decide whether each table could represent a proportional relationship. If the relationship could be proportional, what would be the constant of proportionality?
a. The number of wheels on a group of buses.
b. The number of wheels on a train. - Noah was assigned to make 64 cookies for the bake sale. He made 125% of that number. 90% of the cookies he made were sold. How many of Noah’s cookies were left after the bake sale?
The Open Up Resources math curriculum is free to download from the Open Up Resources website and is also available from Illustrative Mathematics.
Try out our new and fun Fraction Concoction Game.
Add and subtract fractions to make exciting fraction concoctions following a recipe. There are four levels of difficulty: Easy, medium, hard and insane. Practice the basics of fraction addition and subtraction or challenge yourself with the insane level.

We welcome your feedback, comments and questions about this site or page. Please submit your feedback or enquiries via our Feedback page.
