Illustrative Mathematics Grade 7, Unit 6, Lesson 3: Reasoning about Contexts with Tape Diagrams (Part 2)
Learning Targets:
- I can match equations and tape diagrams that represent the same situation.
- If I have an equation, I can draw a tape diagram that shows the same relationship.
Related Pages
Illustrative Math
Grade 7
Lesson 3: Reasoning about Contexts with Tape Diagrams (Part 2)
Let’s see how equations can describe tape diagrams.
Illustrative Math Unit 7.6, Lesson 3 (printable worksheets)
Lesson 3 Summary
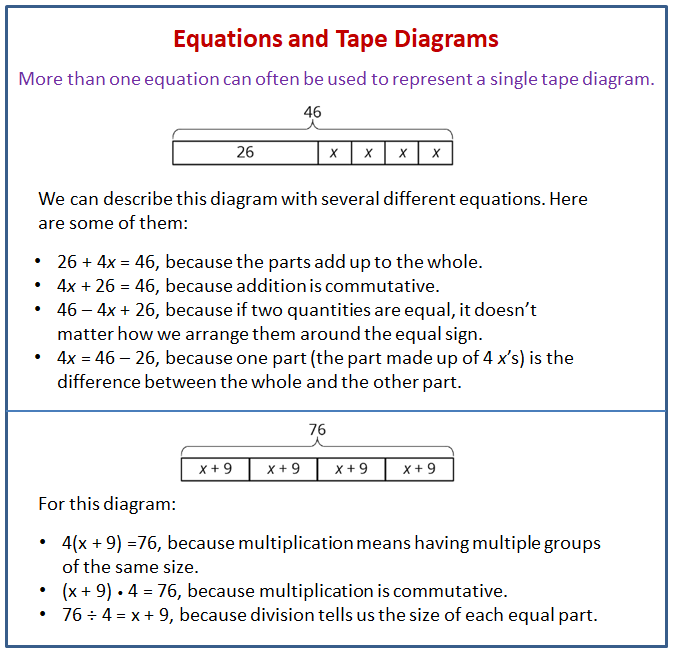
The following diagram shows how equations can describe tape diagrams.

Lesson 3.1 Find Equivalent Expressions
Select all the expressions that are equivalent to 7(2 - 3n). Explain how you know each expression you select is equivalent.
- 9 - 10n
- 14 - 3n
- 14 - 21n
- (2 - 3n) · 7
- 7 · 2 · (-3n)
Lesson 3.2 Matching Equations to Tape Diagrams
- Match each equation to one of the tape diagrams. Be prepared to explain how the equation matches the diagram.
- Sort the equations into categories of your choosing. Explain the criteria for each category.
- Drawing Tape Diagrams to Represent Equations
Lesson 3.3 Drawing Tape Diagrams to Represent Equations
Draw a tape diagram to match each equation.
114 = 3x + 18
Open Applet
114 = 3(y + 18)
Open Applet
Use any method to find values for x and y that make the equations true.
Are you ready for more?
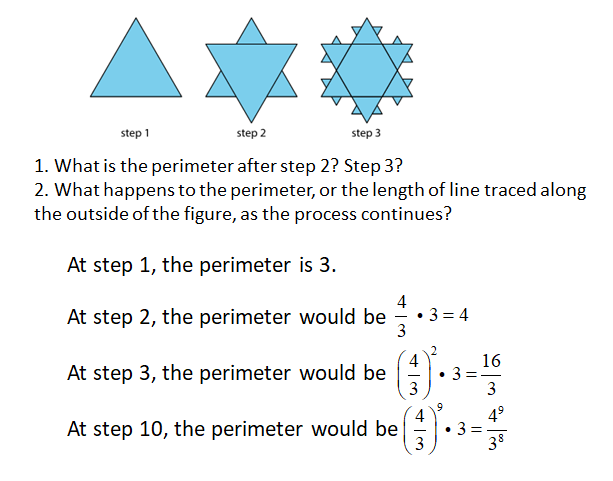
To make a Koch snowflake:
- Start with an equilateral triangle that has side lengths of 1. This is step 1.
- Replace the middle third of each line segment with a small equilateral triangle with the middle third of the segment forming the base. This is step 2.
- Do the same to each of the line segments. This is step 3.
- Keep repeating this process.
- What is the perimeter after step 2? Step 3?
- What happens to the perimeter, or the length of line traced along the outside of the figure, as the process continues?
Lesson 3 Practice Problems
- The table shows the number of apples and the total weight of the apples.
Estimate the weight of 6 apples. - Select all stories that the tape diagram can represent. A. There are 87 children and 39 adults at a show. The seating in the theater is split into 4 equal sections. B. There are 87 first graders in after-care. After 39 students are picked up, the teacher put the remaining students into 4 groups for an activity. C. Lin buys a pack of 87 pencils. She gives 39 to her teacher and shared the remaining pencils between herself and 3 friends. D. Andre buys 4 packs of paper clips with 39 paper clips in each. Then he gives 87 paper clips to his teacher. E. Diego’s family spends $87 on 4 tickets to the fair and a $39 dinner.
- Andre wants to save $40 to buy a gift for his dad. Andre’s neighbor will pay him weekly to mow the lawn, but Andre always gives a $2 donation to the food bank in weeks when he earns money. Andre calculates that it will take him 5 weeks to earn the money for his dad’s gift. He draws a tape diagram to represent the situation. a. Explain how the parts of the tape diagram represent the story. b. How much does Andre’s neighbor pay him each week to mow the lawn?
- Without evaluating each expression, determine which value is the greatest. Explain how you know.
- Solve each equation.
The Open Up Resources math curriculum is free to download from the Open Up Resources website and is also available from Illustrative Mathematics.
Try out our new and fun Fraction Concoction Game.
Add and subtract fractions to make exciting fraction concoctions following a recipe. There are four levels of difficulty: Easy, medium, hard and insane. Practice the basics of fraction addition and subtraction or challenge yourself with the insane level.

We welcome your feedback, comments and questions about this site or page. Please submit your feedback or enquiries via our Feedback page.
