Scatter Plot and Line of Best Fit
Related Topics:
More Lessons for Grade 8
Math Worksheets
Examples, solutions, videos, worksheets, and lessons to help Grade 8 students learn about Scatter Plots, Line of Best Fit and Correlation.
Scatter Plot
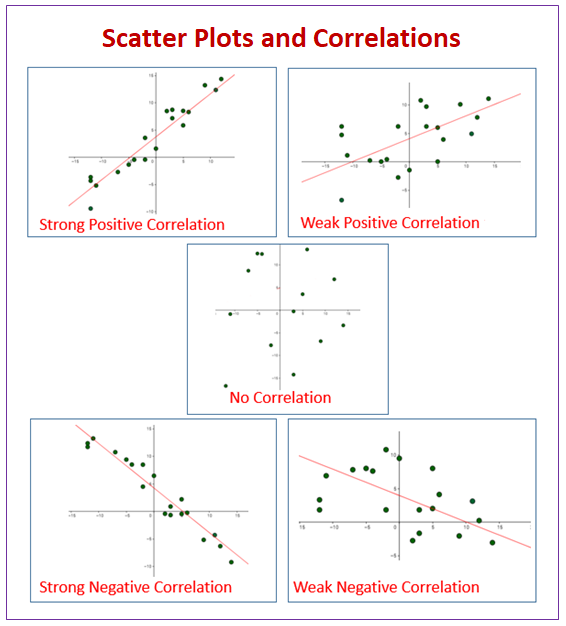
A scatter plot or scatter diagram is a two-dimensional graph in which the points corresponding to two related factors are graphed and observed for correlation. A downward trend in points shows a negative correlation. An upward trend in points shows a positive correlation. If there is no trend in graph points then there is no correlation.
The following diagram shows some examples of scatter plots and correlations. Scroll down the page for more examples and solutions using scatter plots, correlations and lines of best fit.

Statistics Worksheets
Practice your skills with the following worksheets:
Printable & Online Statistics Worksheets
A scatter plot is a visual representation of the relationship between two numerical variables. Each point on the scatter plot represents a single observation (or data point), with its position determined by the values of the two variables for that observation.
X-axis (Horizontal Axis): Usually represents the independent variable (the variable that is manipulated or changes naturally).
Y-axis (Vertical Axis): Usually represents the dependent variable (the variable that is measured and expected to change in response to the independent variable).
Points: Each dot on the plot corresponds to a pair of data values (x,y).
Purpose and When to Use Scatter Plots 1. Visualizing Relationships/Correlations: They help you quickly see if there’s a pattern, trend, or association between two variables. 2. Identifying Direction: Is the relationship positive (as one variable increases, the other tends to increase) or negative (as one increases, the other tends to decrease)? Or is there no clear direction? 3. Assessing Strength: How closely do the points cluster around a potential trend? Are they tightly packed or widely spread? 4. Detecting Outliers: Points that fall far away from the general pattern can indicate unusual observations or data errors. 5. Identifying Clusters: Sometimes, points might form distinct groups or clusters, suggesting underlying categories within the data.
Videos
Scatter Plot
In this video, you will learn that a scatter plot is a graph in which the data is plotted as points on a coordinate grid, and note that a “best-fit line” can be drawn to determine the trend in the data. If the x-values increase as the y-values increase, the scatter plot represents a positive correlation. If the x-values increase as the y-values decrease, the scatter plot represents a negative correlation. If the data is spread out so that it is not possible to draw a “best-fit line”, there is no correlation.
Creating a Scatter Plot.
Learn Scatter Plots and Best Fitting Lines.
This video explains what a scatter plot is and how to find the best fitting line.
Scatter plot graphs, correlation, line of best fit, univariate data and bivariate data.
Scatter Plots : Introduction to Positive and Negative Correlation.
Interpreting Scatterplots
Starts with a description of how to plot a scatterplot from a table.
How to interpret scatterplots in terms of direction, form, strength and outliers?
Try out our new and fun Fraction Concoction Game.
Add and subtract fractions to make exciting fraction concoctions following a recipe. There are four levels of difficulty: Easy, medium, hard and insane. Practice the basics of fraction addition and subtraction or challenge yourself with the insane level.

We welcome your feedback, comments and questions about this site or page. Please submit your feedback or enquiries via our Feedback page.