Illustrative Mathematics Grade 8, Unit 3, Lesson 3: Representing Proportional Relationships
Learning Targets:
- I can scale and label a coordinate axes in order to graph a proportional relationship.
Related Pages
Illustrative Math
Grade 8
Lesson 3: Representing Proportional Relationships
Let’s graph proportional relationships.
Illustrative Math Unit 8.3, Lesson 3 (printable worksheets)
Lesson 3 Summary
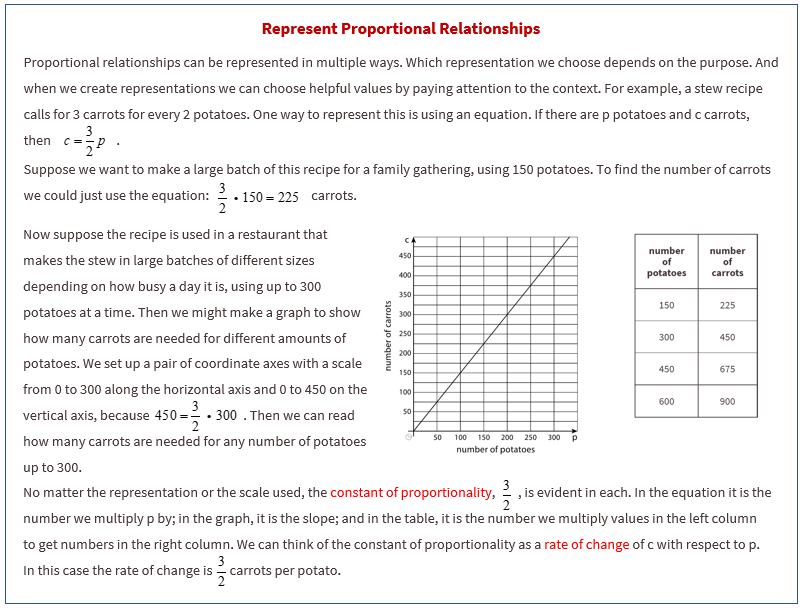
The following diagram shows how to scale and label a coordinate axes in order to graph a proportional relationship.

Lesson 3.1 Number Talk: Multiplication
Find the value of each product mentally.
Lesson 3.2 Representations of Proportional Relationships
Here are two ways to represent a situation.
Description: Jada and Noah counted the number of steps they took to walk a set distance. To walk the same distance,
- Jada took 8 steps
- Noah took 10 steps
Equation: Let x represent the number of steps Jada takes and let y represent the number of steps Noah takes.
y = 5/4 x
Then they found that when Noah took 15 steps, Jada took 12 steps.
a. Create a table that represents this situation with at least 3 pairs of values.
b. Graph this relationship and label the axes.
c. How can you see or calculate the constant of proportionality in each representation? What does it mean?
d. Explain how you can tell that the equation, description, graph, and table all represent the same situation.
- Here are two ways to represent a situation.
Description: The Origami Club is doing a car wash fundraiser to raise money for a trip. They charge the same price for every car. After 11 cars, they raised a total of $93.50. After 23 cars, they raised a total of $195.50. a. Write an equation that represents this situation. (Use c to represent number of cars and use m to represent amount raised in dollars.)
b. Create a graph that represents this situation.
c. How can you see or calculate the constant of proportionality in each representation? What does it mean?
d. Explain how you can tell that the equation, description, graph, and table all represent the same situation.
Lesson 3.3 Info Gap: Proportional Relationships
Your teacher will give you either a problem card or a data card. Do not show or read your card to your partner.
If your teacher gives you the problem card:
- Silently read your card and think about what information you need to answer the question.
- Ask your partner for the specific information that you need.
- Explain to your partner how you are using the information to solve the problem.
- Solve the problem and explain your reasoning to your partner.
If your teacher gives you the data card: - Silently read the information on your card.
- Ask your partner “What specific information do you need?” and wait for your partner to ask for information. Only give information that is on your card. (Do not figure out anything for your partner!)
- Before telling your partner the information, ask “Why do you need that information?”
- After your partner solves the problem, ask them to explain their reasoning and listen to their explanation.
Pause here so your teacher can review your work. Ask your teacher for a new set of cards and repeat the activity, trading roles with your partner.
Are you ready for more?
Ten people can dig five holes in three hours. If n people digging at the same rate dig m holes in d hours:
- Is n proportional to m when d = 3?
-
Show Answers
n is proportional to m.
-
Show Answers
- Is n proportional to d when m = 5?
-
Show Answers
n is not proportional to d.
-
Show Answers
- Is m proportional to d when n = 10?
-
Show Answers
m is proportional to d.
-
Show Answers
Lesson 3 Practice Problems
- Here is a graph of the proportional relationship between calories and grams of fish:
a. Write an equation that reflects this relationship using x to represent the amount of fish in grams and y to represent the number of calories.
b. Use your equation to complete the table: - Students are selling raffle tickets for a school fundraiser. They collect $24 for every 10 raffle tickets they sell.
a. Suppose M is the amount of money the students collect for selling R raffle tickets. Write an equation that reflects the relationship between M and R.
b. Label and scale the axes and graph this situation with M on the vertical axis and R on the horizontal axis. Make sure the scale is large enough to see how much they would raise if they sell 1000 tickets. - Describe how you can tell whether a line’s slope is greater than 1, equal to 1, or less than 1.
- A line is represented by the equation y/(x-2) = 3/11. What are the coordinates of some points that lie on the line? Graph the line on graph paper.
The Open Up Resources math curriculum is free to download from the Open Up Resources website and is also available from Illustrative Mathematics.
Try out our new and fun Fraction Concoction Game.
Add and subtract fractions to make exciting fraction concoctions following a recipe. There are four levels of difficulty: Easy, medium, hard and insane. Practice the basics of fraction addition and subtraction or challenge yourself with the insane level.

We welcome your feedback, comments and questions about this site or page. Please submit your feedback or enquiries via our Feedback page.