Illustrative Mathematics Grade 7, Unit 2, Lesson 7: Comparing Relationships with Tables
Learning Targets:
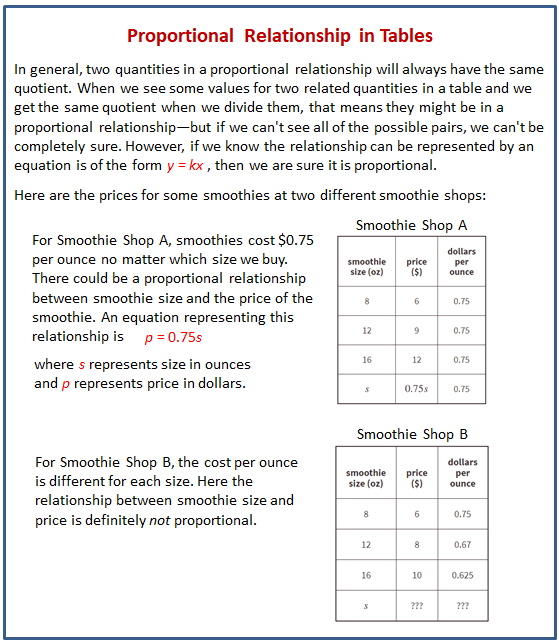
- I can decide if a relationship represented by a table could be proportional and when it is definitely not proportional.
Related Pages
Illustrative Math
Grade 7
Lesson 7: Comparing Relationships with Tables
Let’s explore how proportional relationships are different from other relationships.
Illustrative Math Unit 7.2, Lesson 7 (printable worksheets)
Lesson 7 Summary
The following diagram shows how a relationship represented by a table could be proportional and when it is definitely not proportional.

Lesson 7.1 Adjusting a Recipe
A lemonade recipe calls for the juice of 5 lemons, 2 cups of water, and 2 tablespoons of honey.
Invent four new versions of this lemonade recipe:
- One that would make more lemonade but taste the same as the original recipe.
- One that would make less lemonade but taste the same as the original recipe.
- One that would have a stronger lemon taste than the original recipe.
- One that would have a weaker lemon taste than the original recipe.
Lesson 7.2 Visiting the State Park
Entrance to a state park costs $6 per vehicle, plus $2 per person in the vehicle.
- How much would it cost for a car with 2 people to enter the park? 4 people? 10 people? Record your answers in the table.
- For each row in the table, if each person in the vehicle splits the entrance cost equally, how much will each person pay?
- How might you determine the entrance cost for a bus with 50 people?
- Is the relationship between the number of people and the total entrance cost a proportional relationship? Explain how you know.
Are you ready for more?
What equation could you use to find the total entrance cost for a vehicle with any number of people?
-
Show Answer
cost = 2 · number of people + 6
c = 2p + 6
Lesson 7.3 Running Laps
Han and Clare were running laps around the track. The coach recorded their times at the end of laps 2, 4, 6, and 8.
- Is Han running at a constant pace? Is Clare? How do you know?
- Write an equation for the relationship between distance and time for anyone who is running at a constant pace.
Lesson 7 Practice Problems
- Decide whether each table could represent a proportional relationship. If the relationship could be proportional, what would the constant of proportionality be?
a. How loud a sound is depending on how far away you are.
b. The cost of fountain drinks at Hot Dog Hut. - A taxi service charges $1.00 for the first 1/10 mile then $0.10 for each additional 1/10 mile after that.
Fill in the table with the missing information then determine if this relationship between distance traveled and price of the trip is a proportional relationship. - A rabbit and turtle are in a race. Is the relationship between distance traveled and time proportional for either one? If so, write an equation that represents the relationship.
- For each table, answer: What is the constant of proportionality?
- Kiran and Mai are standing at one corner of a rectangular field of grass looking at the diagonally opposite corner. Kiran says that if the field were twice as long and twice as wide, then it would be twice the distance to the far corner. Mai says that it would be more than twice as far, since the diagonal is even longer than the side lengths. Do you agree with either of them?
The Open Up Resources math curriculum is free to download from the Open Up Resources website and is also available from Illustrative Mathematics.
Try out our new and fun Fraction Concoction Game.
Add and subtract fractions to make exciting fraction concoctions following a recipe. There are four levels of difficulty: Easy, medium, hard and insane. Practice the basics of fraction addition and subtraction or challenge yourself with the insane level.

We welcome your feedback, comments and questions about this site or page. Please submit your feedback or enquiries via our Feedback page.