Illustrative Mathematics Grade 7, Unit 2, Lesson 5: Two Equations for Each Relationship
Learning Targets:
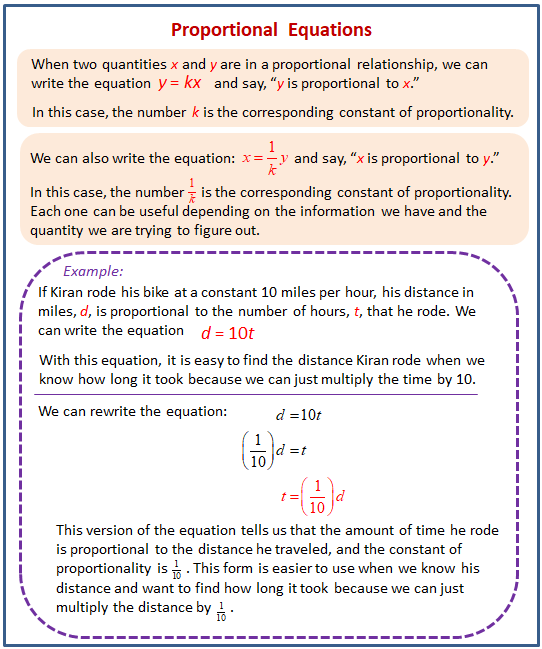
- I can find two constants of proportionality for a proportional relationship.
- I can write two equations representing a proportional relationship described by a table or story.
Related Pages
Illustrative Math
Grade 7
Lesson 5: Two Equations for Each Relationship
Let’s investigate the equations that represent proportional relationships.
Illustrative Math Unit 7.2, Lesson 5 (printable worksheets)
Lesson 5 Summary
The following diagram shows how to find two constants of proportionality and write two equations for a proportional relationship.

Lesson 5.1 Missing Figures
Here are the second and fourth figures in a pattern.
- What do you think the first and third figures in the pattern look like?
- Describe the 10th figure in the pattern.
Lesson 5.2 Feeding a Crowd, Revisited
There are 100 centimeters (cm) in every meter (m).
- Complete each of the tables.
- For each table, find the constant of proportionality.
- What is the relationship between these constants of proportionality?
- For each table, write an equation for the proportional relationship. Let x represent a length measured in meters and y represent the same length measured in centimeters.
Are you ready for more?
- How many cubic centimeters are there in a cubic meter?
-
Show Answer
1 meter = 100 centimeters
1 cubic meter = 1003 centimeters = 1,000,000 centimeters
-
Show Answer
- How do you convert cubic centimeters to cubic meters?
-
Show Answer
To convert cubic centimeters to cubic meters we divide by 1,000,000
-
Show Answer
- How do you convert the other way?
-
Show Answer
To convert cubic meters to cubic centimeters we multiply by 1,000,000
-
Show Answer
Lesson 5.3 Filling a Water Cooler
It took Priya 5 minutes to fill a cooler with 8 gallons of water from a faucet that was flowing at a steady rate. Let w be the number of gallons of water in the cooler after t minutes.
- Which of the following equations represent the relationship between w and t? Select all that apply.
a. w = 1.6t
b. w = 0.625t
c. t = 1.6w
d. t = 0.625w - What does 1.6 tell you about the situation?
- What does 0.625 tell you about the situation?
- Priya changed the rate at which water flowed through the faucet. Write an equation that represents the relationship of and w when t it takes 3 minutes to fill the cooler with 1 gallon of water.
- Was the cooler filling faster before or after Priya changed the rate of water flow? Explain how you know.
Lesson 5.4 Feeding Shrimp
At an aquarium, a shrimp is fed 1/5 gram of food each feeding and is fed 3 times each day.
- How much food does a shrimp get fed in one day?
- Complete the table to show how many grams of food the shrimp is fed over different numbers of days.
- What is the constant of proportionality? What does it tell us about the situation?
- If we switched the columns in the table, what would be the constant of proportionality? Explain your reasoning.
- Use d for number of days and f for amount of food in grams that a shrimp eats to write two equations that represent the relationship between d and f.
- If a tank has 10 shrimp in it, how much food is added to the tank each day?
- If the aquarium manager has 300 grams of shrimp food for this tank of 10 shrimp, how many days will it last? Explain or show your reasoning.
Lesson 5 Practice Problems
- The table represents the relationship between a length measured in meters and the same length measured in kilometers.
a. Complete the table.
b. Write an equation for converting the number of meters to kilometers. Use x for number of meters and y for number of kilometers. - Concrete building blocks weigh 28 pounds each. Using b for the number of concrete blocks and w for the weight, write two equations that relate the two variables. One equation should begin with w = and the other should begin with b =.
- A store sells rope by the meter. The equation p = 0.8L represents the price p (in dollars) of a piece of nylon rope that is L meters long.
a. How much does the nylon rope cost per meter?
b. How long is a piece of nylon rope that costs $1.00? - The table represents a proportional relationship. Find the constant of proportionality and write an equation to represent the relationship.
- On a map of Chicago, 1 cm represents 100 m. Select all statements that express the same scale.
A. 5 cm on the map represents 50 m in Chicago.
B. 1 mm on the map represents 10 m in Chicago.
C. 1 km in Chicago is represented by 10 cm the map.
D. 100 cm in Chicago is represented by 1 m on the map.
The Open Up Resources math curriculum is free to download from the Open Up Resources website and is also available from Illustrative Mathematics.
Try out our new and fun Fraction Concoction Game.
Add and subtract fractions to make exciting fraction concoctions following a recipe. There are four levels of difficulty: Easy, medium, hard and insane. Practice the basics of fraction addition and subtraction or challenge yourself with the insane level.

We welcome your feedback, comments and questions about this site or page. Please submit your feedback or enquiries via our Feedback page.