Illustrative Mathematics Grade 7, Unit 4, Lesson 9: More and Less than 1%
Learning Targets:
- I can find percentages of quantities like 12.5% and 0.4%.
- I understand that to find 0.1% of an amount I have to multiply by 0.001.
Related Pages
Illustrative Math
Grade 7
Lesson 9: More and Less than 1%
Let’s explore percentages smaller than 1%.
Illustrative Math Unit 7.4, Lesson 9 (printable worksheets)
Lesson 9 Summary
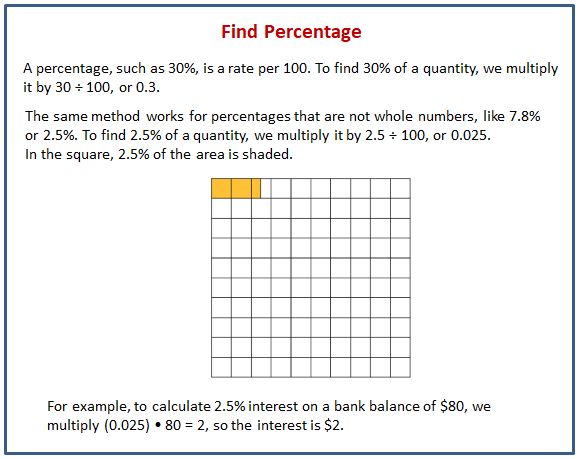
The following diagram shows how to find percentages of quantities.

Lesson 9.1 Number Talk: What Percentage?
Determine the percentage mentally.
10 is what percentage of 50?
5 is what percentage of 50?
1 is what percentage of 50?
17 is what percentage of 50?
Lesson 9.2 Waiting Tables
During one waiter’s shift, he delivered appetizers, entrées, and desserts. What percentage of the dishes were desserts? appetizers? entrées? What do your percentages add up to?
Open Applet
Lesson 9.3 Fractions of a Percent
- Find each percentage of 60. What do you notice about your answers?
30% of 60
3% of 60
0.3% of 60
0.03% of 60 - 20% of 5,000 is 1,000 and 21% of 5,000 is 1,050. Find each percentage of 5,000 and be prepared to explain your reasoning. If you get stuck, consider using the double number line diagram.
a. 1% of 5,000
b. 0.1% of 5,000
c. 20.1% of 5,000
d. 20.4% of 5,000 - 15% of 80 is 12 and 16% of 80 is 12.8. Find each percentage of 80 and be prepared to explain your reasoning.
a. 15.1% of 80
b. 15.7% of 80
Are you ready for more?
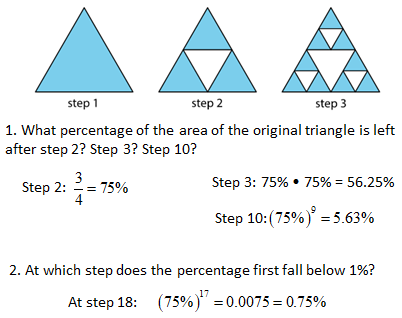
To make Sierpinski’s triangle,
Start with an equilateral triangle. This is step 1.
Connect the midpoints of every side, and remove the middle triangle, leaving three smaller triangles. This is step 2.
Do the same to each of the remaining triangles. This is step 3.
Keep repeating this process.
- What percentage of the area of the original triangle is left after step 2? Step 3? Step 10?
- At which step does the percentage first fall below 1%?
Lesson 9.4 Population Growth
- The population of City A was approximately 243,000 people, and it increased by 8% in one year. What was the new population?
- The population of city B was approximately 7,150,000, and it increased by 0.8% in one year. What was the new population?
Lesson 9 Practice Problems
- The student government snack shop sold 32 items this week.
For each snack type, what percentage of all snacks sold were of that type? - Select all the options that have the same value as 3 1/2% of 20.
- 22% of 65 is 14.3. What is 22.6% of 65? Explain your reasoning.
- A bakery used 30% more sugar this month than last month. If the bakery used 560 kilograms of sugar last month, how much did it use this month?
- Match each diagram to a situation. The diagrams can be used more than once.
a. The amount of apples this year decreased by 15% compared with last year’s amount.
b. The amount of pears this year is 85% of last year’s amount.
c. The amount of cherries this year increased by 15% compared with last year’s amount.
d. The amount of oranges this year is 115% of last year’s amount. - A certain type of car has room for 4 passengers.
a. Write an equation relating the number of cars (n) to the number of passengers (p).
b. How many passengers could fit in 78 cars?
c. How many cars would be needed to fit 78 passengers?
The Open Up Resources math curriculum is free to download from the Open Up Resources website and is also available from Illustrative Mathematics.
Try out our new and fun Fraction Concoction Game.
Add and subtract fractions to make exciting fraction concoctions following a recipe. There are four levels of difficulty: Easy, medium, hard and insane. Practice the basics of fraction addition and subtraction or challenge yourself with the insane level.

We welcome your feedback, comments and questions about this site or page. Please submit your feedback or enquiries via our Feedback page.
