Illustrative Mathematics Grade 7, Unit 8, Lesson 9: Multi-step Experiments
Learning Targets:
- I can use the sample space to calculate the probability of an event in a multi-step experiment.
Related Pages
Illustrative Math
Grade 7
Lesson 9: Multi-step Experiments
Let’s look at probabilities of experiments that have multiple steps.
Illustrative Math Unit 7.8, Lesson 9 (printable worksheets)
Lesson 9 Summary
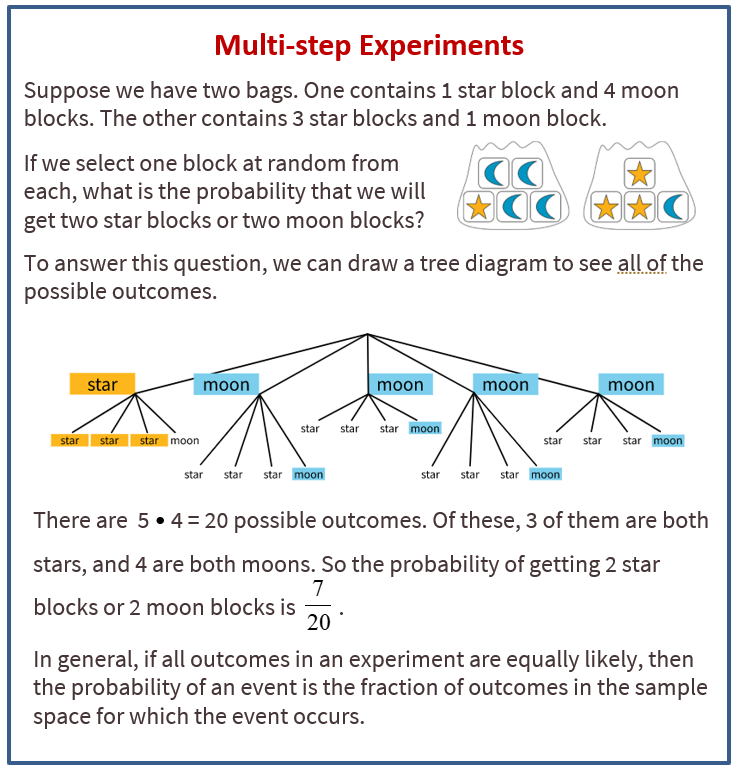
The following diagram shows how to use the sample space to calculate the probability of an event in a multi-step experiment.

Lesson 9.1 True or False?
Is each equation true or false? Explain your reasoning.
8 = (8 + 8 + 8 + 8) ÷ 3
(10 + 10 + 10 + 10 + 10) ÷ 5 = 10
(6 + 4 + 6 + 4 + 6 + 4) ÷ 6 = 5
Lesson 9.2 Spinning a Color and Number
The other day, you wrote the sample space for spinning each of these spinners once.
What is the probability of getting:
- Green and 3?
- Blue and any odd number?
- Any color other than red and any number other than 2?
Lesson 9.3 Cubes and Coins
The other day you looked at a list, a table, and a tree that showed the sample space for rolling a number cube and flipping a coin.
- Your teacher will assign you one of these three structures to use to answer these questions. Be prepared to explain your reasoning.
a. What is the probability of getting tails and a 6?
b. What is the probability of getting heads and an odd number?
Pause here so your teacher can review your work. - Suppose you roll two number cubes. What is the probability of getting:
a. Both cubes showing the same number?
b. Exactly one cube showing an even number?
c. At least one cube showing an even number?
d. Two values that have a sum of 8?
e. Two values that have a sum of 13? - Jada flips three quarters. What is the probability that all three will land showing the same side?
Lesson 9.4 Pick a Card
Imagine there are 5 cards. They are colored red, yellow, green, white, and black. You mix up the cards and select one of them without looking. Then, without putting that card back, you mix up the remaining cards and select another one.
- Write the sample space and tell how many possible outcomes there are.
- What structure did you use to write all of the outcomes (list, table, tree, something else)? Explain why you chose that structure.
- What is the probability that:
a. You get a white card and a red card (in either order)?
b. You get a black card (either time)?
c. You do not get a black card (either time)?
d. You get a blue card?
e. You get 2 cards of the same color?
f. You get 2 cards of different colors?
Are you ready for more?
In a game using five cards numbered 1, 2, 3, 4, and 5, you take two cards and add the values together. If the sum is 8, you win. Would you rather pick a card and put it back before picking the second card, or keep the card in your hand while you pick the second card? Explain your reasoning.
-
Show Answers
I would rather pick a card and put it back before picking the second card because this allows for the possibility of picking two 4’s to get a sum of 8.
Lesson 9 Practice Problems
- A vending machine has 5 colors (white, red, green, blue, and yellow) of gumballs and an equal chance of dispensing each. A second machine has 4 different animal-shaped rubber bands (lion, elephant, horse, and alligator) and an equal chance of dispensing each. If you buy one item from each machine, what is the probability of getting a yellow gumball and a lion band?
- The numbers 1 through 10 are put in one bag. The numbers 5 through 14 are put in another bag. When you pick one number from each bag, what is the probability you get the same number?
- When rolling 3 standard number cubes, the probability of getting all three numbers to match is 6/216. What is the probability that the three numbers do not all match? Explain your reasoning.
- For each event, write the sample space and tell how many outcomes there are.
a. Roll a standard number cube. Then flip a quarter.
b. Select a month. Then select 2020 or 2025. - On a graph of the area of a square vs. its perimeter, a few points are plotted.
a. Add some more ordered pairs to the graph.
b. Is there a proportional relationship between the area and perimeter of a square? Explain how you know.
The Open Up Resources math curriculum is free to download from the Open Up Resources website and is also available from Illustrative Mathematics.
Try out our new and fun Fraction Concoction Game.
Add and subtract fractions to make exciting fraction concoctions following a recipe. There are four levels of difficulty: Easy, medium, hard and insane. Practice the basics of fraction addition and subtraction or challenge yourself with the insane level.

We welcome your feedback, comments and questions about this site or page. Please submit your feedback or enquiries via our Feedback page.