Illustrative Mathematics Grade 8, Unit 3, Lesson 5: Introduction to Linear Relationships
Learning Targets:
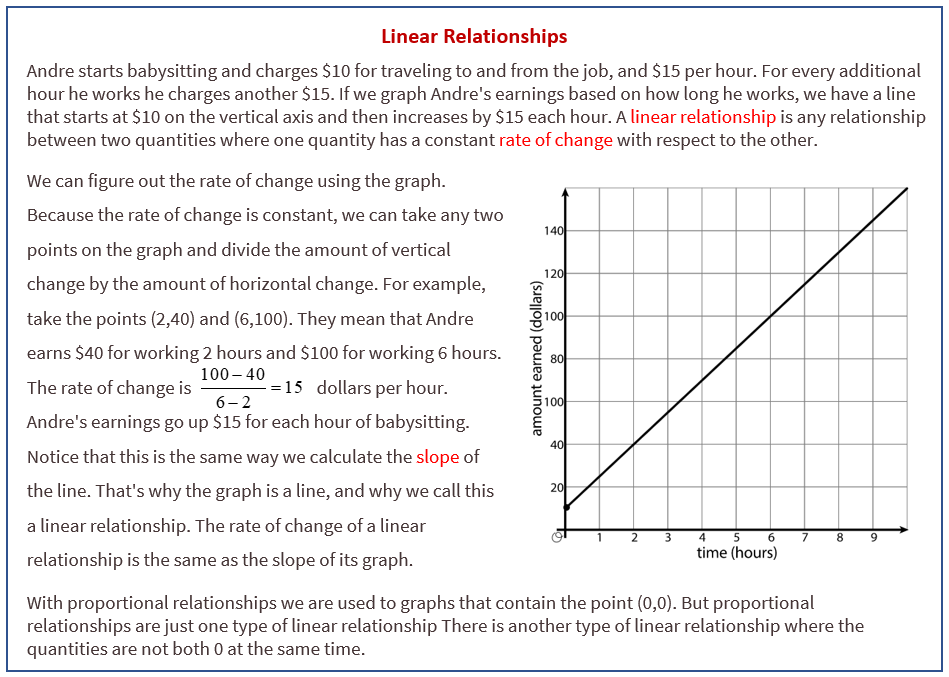
- I can find the rate of change of a linear relationship by figuring out the slope of the line representing the relationship.
Related Pages
Illustrative Math
Grade 8
Lesson 5: Introduction to Linear Relationships
Let’s explore some relationships between two variables.
Illustrative Math Unit 8.3, Lesson 5 (printable worksheets)
Lesson 5 Summary
The following diagram shows how to find the rate of change of a linear relationship by figuring out the slope of the line representing the relationship.

Lesson 5.1 Number Talk: Fraction Division
Find the value of 2 5/8 ÷ 1/2
Lesson 5.2 Stacking Cups
We have two stacks of styrofoam cups. One stack has 6 cups, and its height is 15 cm. The other one has 12 cups, and its height is 23 cm. How many cups are needed for a stack with a height of 50 cm?
Lesson 5.3 Connecting Slope to Rate of Change
- If you didn’t create your own graph of the situation before, do so now.
- What are some ways you can tell that the number of cups is not proportional to the height of the stack?
- What is the slope of the line in your graph? What does the slope mean in this situation?
- At what point does your line intersect the vertical axis? What do the coordinates of this point tell you about the cups?
- How much height does each cup after the first add to the stack?
Lesson 5 Practice Problems
- A restaurant offers delivery for their pizzas. The total cost is a delivery fee added to the price of the pizzas. One customer pays $25 to have 2 pizzas delivered. Another customer pays $58 for 5 pizzas. How many pizzas are delivered to a customer who pays $80?
- To paint a house, a painting company charges a flat rate of $500 for supplies, plus $50 for each hour of labor.
a. How much would the painting company charge to paint a house that needs 20 hours of labor? A house that needs 50 hours?
b. Draw a line representing the relationship between x, the number of hours it takes the painting company to finish the house, and y, the total cost of painting the house. Label the two points from the earlier question on your graph.
c. Find the slope of the line. What is the meaning of the slope in this context? - Tyler and Elena are on the cross country team.
Tyler’s distances and times for a training run are shown on the graph.
Elena’s distances and times for a training run are given by the equation y = 8.5x, where x represents distance in miles and y represents time in minutes.
a. Who ran farther in 10 minutes? How much farther? Explain how you know.
b. Calculate each runner’s pace in minutes per mile.
c. Who ran faster during the training run? Explain or show your reasoning. - Write an equation for the line that passes through (2,5) and (6,7).
The Open Up Resources math curriculum is free to download from the Open Up Resources website and is also available from Illustrative Mathematics.
Try out our new and fun Fraction Concoction Game.
Add and subtract fractions to make exciting fraction concoctions following a recipe. There are four levels of difficulty: Easy, medium, hard and insane. Practice the basics of fraction addition and subtraction or challenge yourself with the insane level.

We welcome your feedback, comments and questions about this site or page. Please submit your feedback or enquiries via our Feedback page.