Heating Curve
A series of free Science Lessons for 7th Grade and 8th Grade, KS3 and Checkpoint Science in preparation for GCSE and IGCSE Science.
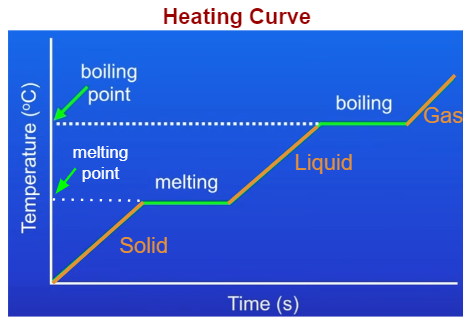
The following diagram shows a heating curve. Scroll down the page for more examples and solutions.

Heating Curve
- The temperature of the solid rises as we increase the energy of the particles.
- At the melting point, the temperature stops rising and the line becomes horizontal.
- The solid continues to melt. The energy we put in is weakening or breaking the forces of attraction between the particles, allowing the substance to change from a solid to a liquid. The energy is called the latent heat. There is a change of state but no change of temperature.
- When all the solid has melted, the temperature of the liquid will rise again.
- At the boiling point, the temperature stops rising again and the line becomes horizontal.
- When all of the liquid has boiled, the temperature of the gas will rise again.
Changes between states/phases of matter
Explanation of states/phases of matter and what happens when water changes from one state/phase to another.
Graph to show the melting and boiling point of a liquid.
Heating Curve Basics
Interpreting a heating curve. Identifying solid, liquid and gas phases.
Kinetic and potential energy changes. Phase changes, boiling and freezing points.
Try out our new and fun Fraction Concoction Game.
Add and subtract fractions to make exciting fraction concoctions following a recipe. There are four levels of difficulty: Easy, medium, hard and insane. Practice the basics of fraction addition and subtraction or challenge yourself with the insane level.

We welcome your feedback, comments and questions about this site or page. Please submit your feedback or enquiries via our Feedback page.