Graphs of Quadratics
A series of free, online Basic Algebra Lessons.
In this lesson, we will learn
- about quadratic graphs
- how to graph quadratic equations or quadratic functions
- vertical and horizontal shifts of quadratic graphs
- dilations or stretching of quadratic graphs
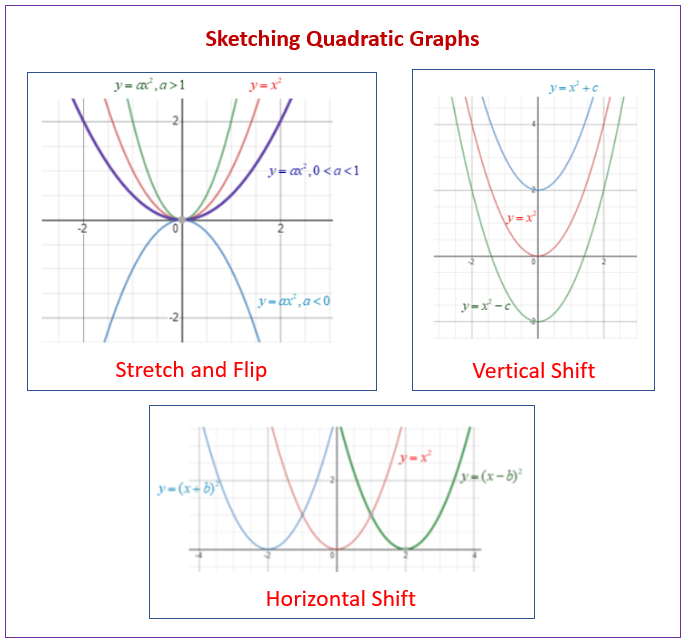
The following diagram shows how to sketch quadratic graphs involving flip, stretch and shift transformations. Scroll down the page for more examples and solutions.

Exploring Quadratic Graphs
When we graph quadratic functions, we always get a parabola (or U) shape and symmetry in the table and graph. One easy way to complete quadratic graphs is to make a table of values by plugging in x-values into the function to calculate the y-value and then plotting these points. When graphing quadratics, other important terms and features include the vertex and axis of symmetry.
Graphing Quadratic Equations
When graphing quadratic equations, there are a few key terms that we can identify to help us graph quadratic functions more efficiently. Instead of plugging in values, we can find specific characteristics such as the y-intercept, x-intercepts, direction, shape, vertex and axis of symmetry. When graphing quadratic equations, it is always best to initially graph the function by hand and then check your work using a graphing calculator if able.
Graphing Quadratic Functions
This video outlines a little recipe of things to examine when graphing a quadratic function by hand. It shows one example of graphing a quadratic function.
Graphing Quadratic Functions in General Form
Vertical and Horizontal Shifts of Quadratic Graphs
Horizontal and vertical graph shifts occur in a graph when the graph either moves up and down on the y-axis or side-to-side on the x-axis. When a graph shifts, the vertex simply moves position but the shape stays the same. We can graph parabolas and these shifts by either using a table of values, critical points or a graphing calculator.
You can shift a graph up or down by adding or subtracting a constant.
Shifting a graph left or right can be achieved by adding or subtracting a constant from the argument of a function
Dilations or Stretches of Quadratic Graphs
When graphing parabolas and other functions, there are certain types of graph dilations that help us graph and explore parabolas more efficiently. When graphing parabolas, dilations occur when the “a” term value is changed. If we change the “a” to a negative, the graph shifts downward instead of upward. As the absolute value of the “a” value increases, the graph becomes “steeper.” If we use a fraction as the “a” value, the graph of the parabola becomes wider.
How to graph parabolas that are wide or skinny or upside down without making a table of values.
Sketching quadratic functions with stretches and flips
Try out our new and fun Fraction Concoction Game.
Add and subtract fractions to make exciting fraction concoctions following a recipe. There are four levels of difficulty: Easy, medium, hard and insane. Practice the basics of fraction addition and subtraction or challenge yourself with the insane level.

We welcome your feedback, comments and questions about this site or page. Please submit your feedback or enquiries via our Feedback page.