Illustrative Mathematics Grade 8, Unit 3, Lesson 2: Graphs of Proportional Relationships
Learning Targets:
- I can graph a proportional relationship from an equation.
- I can tell when two graphs are of the same proportional relationship even if the scales are different.
Related Pages
Illustrative Math
Grade 8
Lesson 2: Graphs of Proportional Relationships
Let’s think about scale.
Illustrative Math Unit 8.3, Lesson 2 (printable worksheets)
Lesson 2 Summary
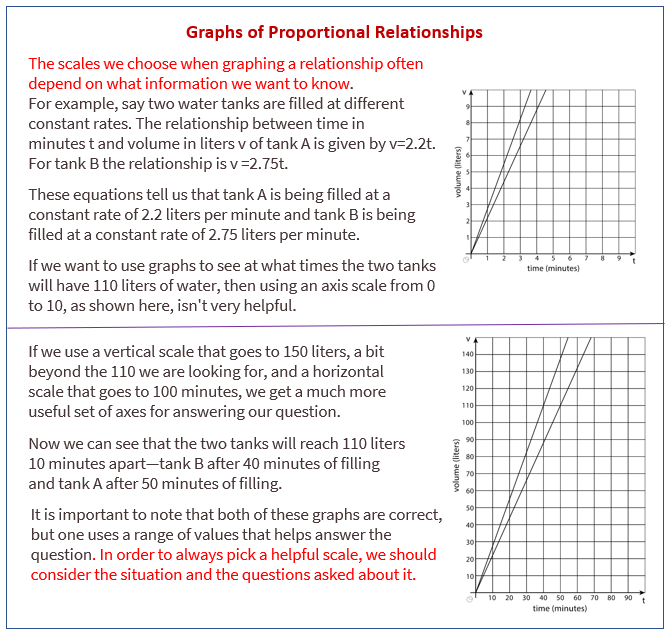
The following diagram shows how to graph a proportional relationship from an equation.

Lesson 2.1 An Unknown Situation
Here is a graph that could represent a variety of different situations.
- Write an equation for the graph.
- Sketch a new graph of this relationship.
Lesson 2.2 Card Sort: Proportional Relationships
Your teacher will give you 12 graphs of proportional relationships.
- Sort the graphs into groups based on what proportional relationship they represent.
- Write an equation for each different proportional relationship you find.
Lesson 2.3 Different Scales
Two large water tanks are filling with water. Tank A is not filled at a constant rate, and the relationship between its volume of water and time is graphed on each set of axes. Tank B is filled at a constant rate of 1/2 liters per minute. The relationship between its volume of water and time can be described by the equation v=1/2 t, where t is the time in minutes and v is the total volume in liters of water in the tank.
- Sketch and label a graph of the relationship between the volume of water v and time t for Tank B on each of the axes.
- Answer the following questions and say which graph you used to find your answer.
a. After 30 seconds, which tank has the most water?
b. At approximately what times do both tanks have the same amount of water?
c. At approximately what times do both tanks contain 1 liter of water? 20 liters?
Are you ready for more?
A giant tortoise travels at 0.17 miles per hour and an arctic hare travels at 37 miles per hour.
- Draw separate graphs that show the relationship between time elapsed, in hours, and distance traveled, in miles, for both the tortoise and the hare.
- Would it be helpful to try to put both graphs on the same pair of axes? Why or why not?
- The tortoise and the hare start out together and after half an hour the hare stops to take a rest. How long does it take the tortoise to catch up?
Lesson 2 Practice Problems
- The tortoise and the hare are having a race. After the hare runs 16 miles the tortoise has only run 4 miles.
The relationship between the distance x the tortoise “runs” in miles for every y miles the hare runs is y = 4x. Graph this relationship. - The table shows a proportional relationship between the weight on a spring scale and the distance the spring has stretched.
a. Complete the table.
b. Describe the scales you could use on the x and y axes of a coordinate grid that would show all the distances and weights in the table. - Find a sequence of rotations, reflections, translations, and dilations showing that one figure is similar to the other. Be specific: give the amount and direction of a translation, a line of reflection, the center and angle of a rotation, and the center and scale factor of a dilation.
- Consider the following dialogue:
Andre said, “I found two figures that are congruent, so they can’t be similar.”
Diego said, “No, they are similar! The scale factor is 1.”
Who is correct? Use the definition of similarity to explain your answer.
The Open Up Resources math curriculum is free to download from the Open Up Resources website and is also available from Illustrative Mathematics.
Try out our new and fun Fraction Concoction Game.
Add and subtract fractions to make exciting fraction concoctions following a recipe. There are four levels of difficulty: Easy, medium, hard and insane. Practice the basics of fraction addition and subtraction or challenge yourself with the insane level.

We welcome your feedback, comments and questions about this site or page. Please submit your feedback or enquiries via our Feedback page.