Graphing Lines by Plotting Points
Related Topics:
More Lessons for Grade 7 Math
Math Worksheets
Examples, videos, solutions, and worksheets to help Grade 7 students learn to graph lines by plotting points.
Graphing lines involves visually representing a linear equation on a coordinate plane.
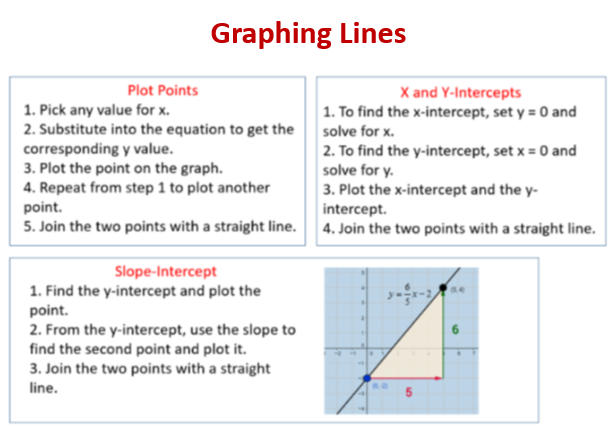
The following diagram shows how to graph lines by plotting points, by using the x and y intercepts and by using the slope-intercept method. Scroll down the page for more examples and solutions.

Coordinate Geometry Worksheets
Practice your skills with the following worksheets:
Printable & Online Coordinate Geometry Worksheets
The following are three common methods for graphing lines on the coordinate plane.
1. Using a Table of Values (Plotting Points):
a. Choose Values for x: Select a few simple values for ‘x’. (e.g., -2, -1, 0, 1, 2).
b. For each chosen ‘x’ value, substitute it into the linear equation and solve for the corresponding ‘y’ value. This gives you ordered pairs (x, y).
c. Plot the Ordered Pairs: Locate each ordered pair on the coordinate plane and mark it with a point.
d. Draw a line that passes through all the plotted points. Extend the line beyond the points and add arrows at both ends to indicate that the line continues infinitely in both directions.
2. Using the Slope-Intercept Form (y = mx + b):
a. The y-intercept is the point where the line crosses the y-axis. In the equation y=mx+b, ‘b’ represents the y-coordinate of this point, which is (0, b). Plot this point.
b. The slope ’m’ represents the “rise over run”
Use the slope (m = rise/run)
From (0,b), move:
Up if rise is positive, down if negative.
Right if run is positive, left if negative.
Plot a second point.
c. Draw a straight line through the y-intercept and the point(s) you found using the slope.
3. Using the Intercepts:
a. Find the x-intercept: Set y=0 in the equation and solve for ‘x’. This gives you the point where the line crosses the x-axis (x, 0). Plot this point.
b. Find the y-intercept: Set x=0 in the equation and solve for ‘y’. This gives you the point where the line crosses the y-axis (0, y). Plot this point.
c. Draw a straight line through the x-intercept and the y-intercept.
Special Cases:
Horizontal Lines: Equations of the form y=c (where ‘c’ is a constant) are horizontal lines passing through the point (0, c). The slope is 0.
Vertical Lines: Equations of the form x=c (where ‘c’ is a constant) are vertical lines passing through the point (c, 0). The slope is undefined.
Graphing Lines by Plotting Points
An introduction to the Rectangular Coordinate System and covers the basic vocabulary, definitions, ordered pairs, and how to plot points on the x-y plane.
How to determine if a given ordered pair is a solution to an equation and therefore a point on the line?
Also shows how to find ordered pair solutions to a linear equation.
How to complete ordered pair solutions if the x or y coordinate is given?
Also covers how to make a table of ordered pair solutions if the equation is solved for y, how to plot those on the x-y plane and graph the line.
Try out our new and fun Fraction Concoction Game.
Add and subtract fractions to make exciting fraction concoctions following a recipe. There are four levels of difficulty: Easy, medium, hard and insane. Practice the basics of fraction addition and subtraction or challenge yourself with the insane level.

We welcome your feedback, comments and questions about this site or page. Please submit your feedback or enquiries via our Feedback page.