Graphing Inequalities with Two Variables
A series of free Basic Algebra Lessons.
In this lesson, we will learn how to graph inequalities with two variables on the coordinate plane.
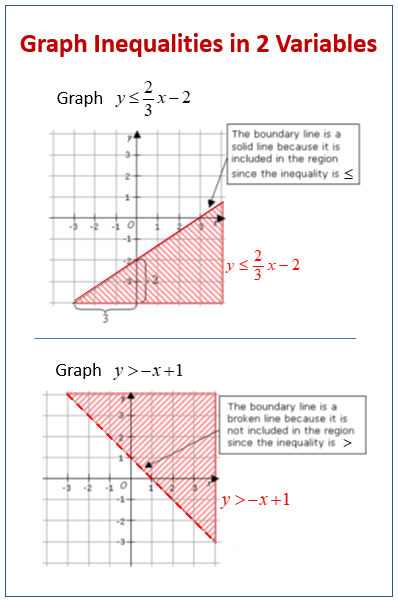
Just like equations, sometimes we have two variables in an inequality. Graphing inequalities with two variables involves shading a region above or below the line to indicate all the possible solutions to the inequality. When graphing inequalities with two variables, we use some of the same techniques used when graphing lines to find the border of our shaded region.
The following diagram shows some examples of graphing inequalities with two variables. Scroll down the page for more examples and solutions.

Solving and graphing linear inequalities in two variables (part 1)
Solving and graphing linear inequalities in two variables (part 2)
Solving and graphing linear inequalities in two variables (part 3)
How to graph a linear inequality with two variables?
How to graph a linear inequality with two variables using the intercept method?
How to graph a linear inequality given in slope-intercept form?
Graphing linear inequalities in 2 variables
Linear inequalities in two variables
Topics include: graphing the solution, determining if a line should be solid or dashed, determining which half-plane to shade.
Try out our new and fun Fraction Concoction Game.
Add and subtract fractions to make exciting fraction concoctions following a recipe. There are four levels of difficulty: Easy, medium, hard and insane. Practice the basics of fraction addition and subtraction or challenge yourself with the insane level.

We welcome your feedback, comments and questions about this site or page. Please submit your feedback or enquiries via our Feedback page.