Illustrative Mathematics Grade 7, Unit 1, Lesson 10: Changing Scales in Scale Drawings
Learning Targets:
- Given a scale drawing, I can create another scale drawing that shows the same thing at a different scale.
- I can use a scale drawing to find actual areas.
Related Pages
Illustrative Math
Grade 7
Lesson 10: Changing Scales in Scale Drawings
Let’s explore different scale drawings of the same actual thing.
Illustrative Math Unit 7.1, Lesson 10 (printable worksheets)
Lesson 10 Summary
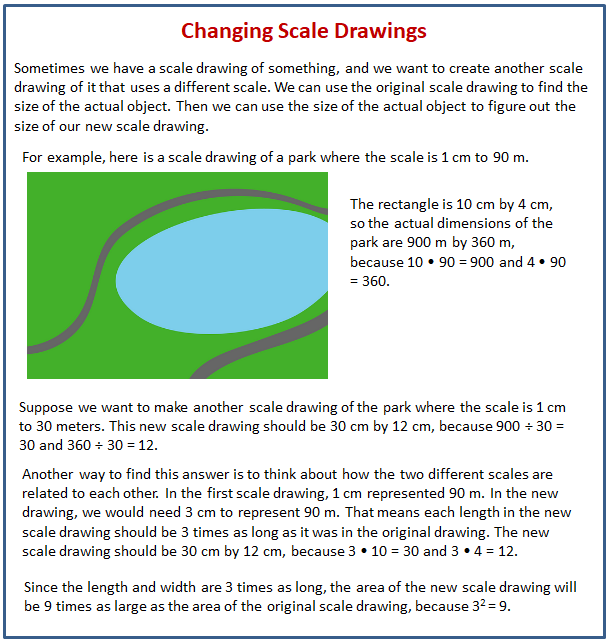
The following diagram shows how to create another scale drawing that shows the same thing at a different scale.

Lesson 10.1 Appropriate Measurements
- If a student uses a ruler like this to measure the length of their foot, which choices would be appropriate measurements? Select all that apply. Be prepared to explain your reasoning.
A. 9 1/4 inches
B. 9 5/64 inches
C. 23.47659 centimeters
D. 23.5 centimeters
E. 23.48 centimeters - Here is a scale drawing of an average seventh-grade student’s foot next to a scale drawing of a foot belonging to the person with the largest feet in the world. Estimate the length of the larger foot.
Lesson 10.2 Same Plot, Different Drawings
Here is a map showing a plot of land in the shape of a right triangle.
- Your teacher will assign you a scale to use. On centimeter graph paper, make a scale drawing of the plot of land. Make sure to write your scale on your drawing.
- What is the area of the triangle you drew? Explain or show your reasoning.
- How many square meters are represented by 1 square centimeter in your drawing?
- After everyone in your group is finished, order the scale drawings from largest to smallest. What do you notice about the scales when your drawings are placed in this order?
Are you ready for more?
Noah and Elena each make a scale drawing of the same triangular plot of land, using the following scales. Make a prediction about the size of each drawing. How would they compare to the scale drawings made by your group?
- Noah uses the scale 1 cm to 200 m.
- Elena uses the scale 2 cm to 25 m.
-
Show Answer
Noah’s scale drawing will be smaller than Elena’s
-
Show Answer
Lesson 10.3 A New Drawing of the Playground
Here is a scale drawing of a playground.
- Make another scale drawing of the same playground at a scale of 1 centimeter to 20 meters.
- How do the two scale drawings compare?
Lesson 10 Practice Problems
- Here is a scale drawing of a swimming pool where 1 cm represents 1 m.
a. How long and how wide is the actual swimming pool?
b. Will a scale drawing where 1 cm represents 2 m be larger or smaller than this drawing?
c. Make a scale drawing of the swimming pool where 1 cm represents 2 m. - A map of a park has a scale of 1 inch to 1,000 feet. Another map of the same park has a scale of 1 inch to 500 feet. Which map is larger? Explain or show your reasoning.
- On a map with a scale of 1 inch to 12 feet, the area of a restaurant is 60 in2. Han says that the actual area of the restaurant is 720 ft2. Do you agree or disagree? Explain your reasoning.
- If Quadrilateral Q is a scaled copy of Quadrilateral P created with a scale factor of 3, what is the perimeter of Q?
- Triangle DEF is a scaled copy of triangle ABC. For each of the following parts of triangle ABC, identify the corresponding part of triangle DEF.
The Open Up Resources math curriculum is free to download from the Open Up Resources website and is also available from Illustrative Mathematics.
Try out our new and fun Fraction Concoction Game.
Add and subtract fractions to make exciting fraction concoctions following a recipe. There are four levels of difficulty: Easy, medium, hard and insane. Practice the basics of fraction addition and subtraction or challenge yourself with the insane level.

We welcome your feedback, comments and questions about this site or page. Please submit your feedback or enquiries via our Feedback page.