Stem And Leaf Plot
In these lessons, we will learn how to draw and interpret a Stem and Leaf Plot.
Related Pages
Stem and Leaf Diagrams
Frequency Distributions
Statistics Lessons
When there are many numbers in a set of data, we can construct a stem-and-leaf plot to show the data and make it easier to read.
The following diagram shows how to construct a stem-and-leaf plot or stemplot. Scroll down the page for more examples and solutions on how to construct and use stem-and-leaf plots.

Drawing A Stem-And-Leaf Plot
Example:
Construct a stem-and-leaf plot for the following set of data.
28 13 26 12 20 14 21 16 17 22
17 25 13 30 13 22 15 21 18 18
16 21 18 31 15 19
Solution:
Step 1: Find the least number and the greatest number in the data set.
The greatest number is 31 (3 in the tens place)
The smallest number is 12 (1 in the tens place)
Step 2: Draw a vertical line and write the digits in the tens places from 1 to 3 on the left of the line. The tens digit form the stems.
![]()
Step 3: Write the units digit to the right of the line. The units digits form the leaves.
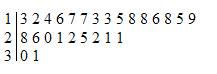
Step 4: Rewrite the units digits in each row from the least to the greatest.
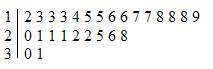
Step 5: Include an explanation (or key).
![]()
Interpret A Stem-And-Leaf Plot
Example:
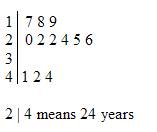
The following stem-and-leaf plot shows the ages of a group of people in a room.
a) How many people were there in the room?
b) Two people have the same age. What is that age?
c) What is the mode, median and mean of the ages?
Solution:
a) We count the number of digits on the right of the line (leaves). There were 12 people in the room.
b) The two people were 22 years old.
c) The mode is 22.
The median can be obtained from the average 6th and 7th data.
The average of 22 and 24 is 23.
The median age is 23
To get the mean, we have to first get the total ages.
17 + 18 + 19 + 20 + 22 + 22 + 24 + 25 + 26 + 41 + 42 + 44 = 320
The mean = ![]() = 26.67
= 26.67
Stem and Leaf Plots
This video shows how to make a stem and leaf plot, also known as a stem plot.
Statistics - How to make a stem and leaf plot
This example shows how to make a stem and leaf plot. Remember that the leading values become our stems
and the trailing values the leaves. There also may be more than one way to represent a stem and leaf plot.
Lesson on Stem and Leaf Plots
It includes demonstration on how to create and read a stem-and-leaf plot and also how to use it to
find Median and Quartiles.
How to create stem-and-leaf plots or frequency tables using given data
Answer questions based on given stem-and-leaf plots or frequency tables.
Try the free Mathway calculator and
problem solver below to practice various math topics. Try the given examples, or type in your own
problem and check your answer with the step-by-step explanations.

We welcome your feedback, comments and questions about this site or page. Please submit your feedback or enquiries via our Feedback page.