
Center and Spread of Data
Examples, solutions, videos, and lessons to help High School students learn how to use statistics appropriate to the shape of the data distribution to compare center (median, mean) and spread (interquartile range,
standard deviation) of two or more different data sets.
Related Topics:
Common Core Statistics
Common Core Mathematics
Related Topics:
Common Core Statistics
Common Core Mathematics
Common Core: HSS-ID.A.2
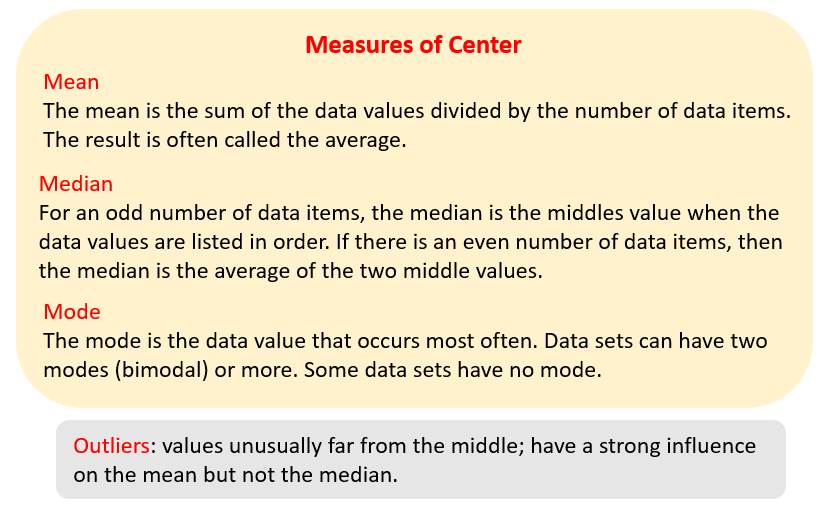
The following figures show the measures of center (mean, median, mode) and outliers. Scroll down the page for more examples and solutions.
CC.9-12.S.ID.2 -- Use statistics appropriate to the shape of the data distribution to compare center (median, mean) and spread (interquartile range, standard deviation) of two or more different data sets.
Example:
LaTanja went to Park Plaza Mall to go shopping. She spent $12.49, $13.75, $12.49, $14.50, %16.65, $17.75, $12.49 and $32.35 on different items she wanted for school. Find the following information: Minimum, Maximum, Range, Mean, Mode, Outliers and Median. Using Measures of Central Tendency - 9th-12th Grades Common Core Mathematics
Determine the effects of changes in a data set on the measures of central tendency.
Examples:
1. The ages of ten seventh-grade students are given. Find the mean, median and mode.
11,12,11,11,12,11,11,12,11,13
2. Find the mean, median, and mode of the ages if the teacher's age, 50, is added to the data set.
11,12,11,11,12,11,11,12,11,13
Now, compare the results of examples 1 and 2. Which measure of central tendency was most affected by the change in the data set? By comparing the results of examples 1 and 2, we see that the mean was most affected by a change in the data set. For this reason, the mean is not the best measure of central tendency when outliers are involved.
3. Companies A and B each have ten employees. Their hourly pay, in dollars, is shown below.
A: 5,5,5,5,5,5,5,5,5,40
B: 5,5,8,8,8,8,8,10,10,15
a) Find the mean hourly pay for each company.
b) If you are starting to work, would you rather work for Company A or Company B? Why?
Examples:
1. This data set shows the number of people who attended a movie theater over a period of 16 days.
{14,23,10,21,7,80,32,30,92,14,26,21,38,20,35,21}
a. Find the measures of center.
b. The theater's management wants to compare its attendance to that of other theaters in the area. Which measure of center best represents the data?
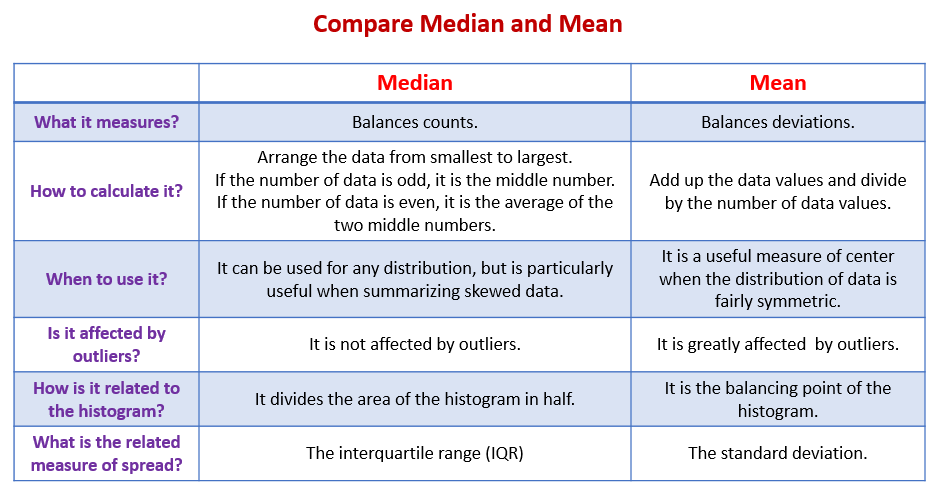
2. Find the five-number summary for the number of points scored by the Chicago Bulls during the 1997-98 season The following table compares median and mean. Scroll down the page for more examples and solutions.

Standard Deviation
The standard deviation measures dispersion by determining how much, on average, the data values vary (or deviate) about the mean.
When the data values are clustered near the mean, the standard deviation is small.
When the data values are scattered far from the mean, the standard deviation is large.
Median Absolute Deviation
The mean absolute deviation is obtained by finding the median of the absolute values of the deviations of the data values from the median.
Mean Absolute Deviation
Common Core State Standard S.ID.2.
Calculating the Mean Absolute Deviation to understand the variance of a set of data.
Try the free Mathway calculator and
problem solver below to practice various math topics. Try the given examples, or type in your own
problem and check your answer with the step-by-step explanations.


We welcome your feedback, comments and questions about this site or page. Please submit your feedback or enquiries via our Feedback page.