

Probability Diagrams (or Possibility Diagrams)
More Probability Lessons
When an experiment is more complex constructing a probability diagram or possibility diagram may be helpful in constructing the sample space.
Example:
The diagram shows two spinners, each of which is divided into 4 equal sectors. Each spinner has a pointer which, when spun, is equally likely to come to rest in any of the four equal sectors.
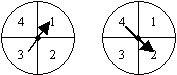
In a game, each pointer is spun once.
Find the probability that
a) the pointers will stop at the same number
b) the first spinner shows the larger number.
Solution:
Construct the probability diagram. Each dot represents a possible outcome according to the coordinates.

a) Let A = event of getting the same number on the two spinners.
From the probability diagram, n(A) = 4, n(S) = 16
P(A) = ![]()
b) Let B = event the first spinner shows the bigger number.
From the probability diagram, n(B) = 6
P(B) =Example:
Two fair dice are thrown together. Find the probability that the sum of the resulting number is
a) odd
b) a prime number
Solution:
Construct the following probability diagram showing the sums: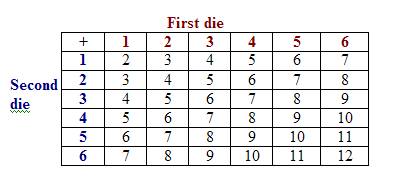
a) Let A be the event that the sum is odd
From the probability diagram, n(A) = 18
P(A) =
b) Let B be the event that the sum is a prime
Count the number of 2, 3, 5, 7 and 11 in the probability diagram.
n(B) = 15
P(B) =
Example:
X = {1, 2, 3} and Y = {4, 5, 6}. An element x is selected from X and an element y is selected from Y.
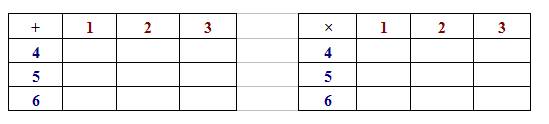
Complete the following probability diagrams for x + y and x × y
i) prime
ii) greater than 7
b) Find the probability that the product xy is:
i) odd
ii) at most 10
Solution:
a) The following probability diagrams for x + y and x × y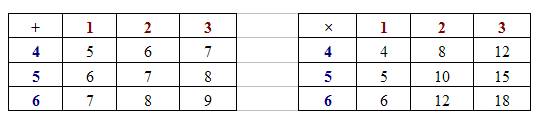
a) The probability that the sum x + y is:
i) prime
Let S be the sample space, and A be the event that the sum is prime.
From the probability diagram, n(A) = 4 ; n(S) = 9
P(A) =
ii) greater than 7
Let S be the sample space, and B be the event that the sum is greater than 7.
From the probability diagram, n(B) = 3 ; n(S) = 9
P(B) =
b) The probability that the product xy is:
i) odd
Let S be the sample space, and C be the event that the product is odd.
From the probability diagram, n(C) = 2 ; n(S) = 9
P(C) = ![]()
ii) at most 10
Let S be the sample space, and D be the event that the product is at most 10.
From the probability diagram, n(D) = 5 ; n(S) = 9
P(D) = ![]()
Probability and Possibility Space diagrams
Examples:
1. Two normal 6-sided fair dice are thrown and the total score is recorded. Construct a possibility space digram showing all possible outcomes and find the probability of scoring a total of 7.
2. A normal 6-sided fair dice is thrown and a coin is tossed. Draw a possibility space diagram showing all the outcomes and find the probability of getting a number less than 3 and a head. How to use diagrams to help solve probability problems?
Example:
What is the probability of getting a certain number roll in Monopoly? How to use a possibility space diagram or sample space diagram to solve word problems?
Example:
Two dice are thrown and their product noted. Draw a possibility space diagram to show all the possible outcomes. Use your diagram to find:
(a) the probability of the product being 12.
(b) the probability that the product is less than 6.
(c) the probability that the product is 20 or more.
Try the free Mathway calculator and
problem solver below to practice various math topics. Try the given examples, or type in your own
problem and check your answer with the step-by-step explanations.

We welcome your feedback, comments and questions about this site or page. Please submit your feedback or enquiries via our Feedback page.